
Analytics, Baltic Export, Baltic States – CIS, EU – Baltic States, Foreign trade , Latvia
International Internet Magazine. Baltic States news & analytics
Thursday, 09.04.2026, 18:29
In July, foreign trade turnover in Latvia decreased by 3.5 % y-o-y
 Print version
During the seven months of this year foreign trade turnover of Latvia at current prices reached EUR 15.31 billion – EUR 1.21 billion or 7.3 % less than in the corresponding period of the previous year. The exports value constituted EUR 7.1 billion (a drop of EUR 233.9 million or 3.2 %), whereas the imports value comprised EUR 8.21 billion (a fall of EUR 979.9 million or 10.7 %).
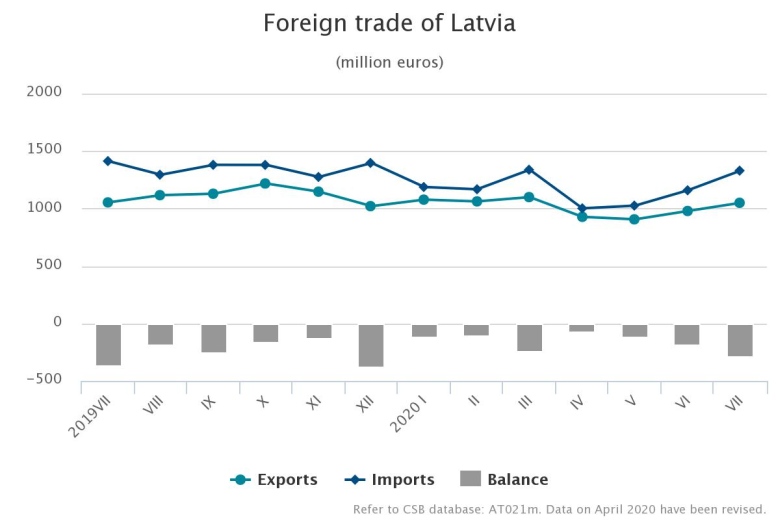
Calendar and seasonally adjusted data show that, compared to July 2019, in July 2020 the exports value at current prices went down by 1.3 % and the imports value by 4.6 %, whereas, compared to the previous month, the exports value went up by 4.4 % ,but the imports value – by 7.1 %.
Main changes in exports in July 2020, compared to July 2019:
- exports of machinery and mechanical appliances; electrical equipment up by EUR 27.8 million or 14.5 %,
- exports of wood and articles of wood up by EUR 7.7 million or 4.4 %,
- exports of mineral products down by EUR 13 million or 23.7 %,
- exports of vehicles and associated transport equipment down by EUR 12.6 million or 18 %,
- exports of base metals and articles of base metals down by EUR 11.9 million or 11.2 %.
Main changes in imports in July 2020, compared to July 2019:
- imports of products of the chemical and allied industries up by EUR 7.7 million or 5.7 %,
- imports of wood and articles of wood up by EUR 6 million or 14.2 %,
- imports of base metals and articles of base metals up by EUR 5.4 million or 4.7 %,
- imports of mineral products down by EUR 67.3 million or 38.9 %,
- imports of vehicles and associated transport equipment down by EUR 34.8 million or 25.5 %.
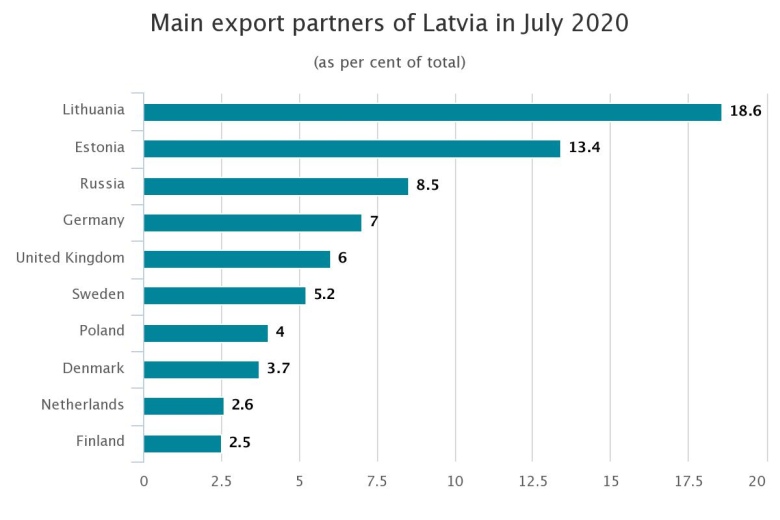
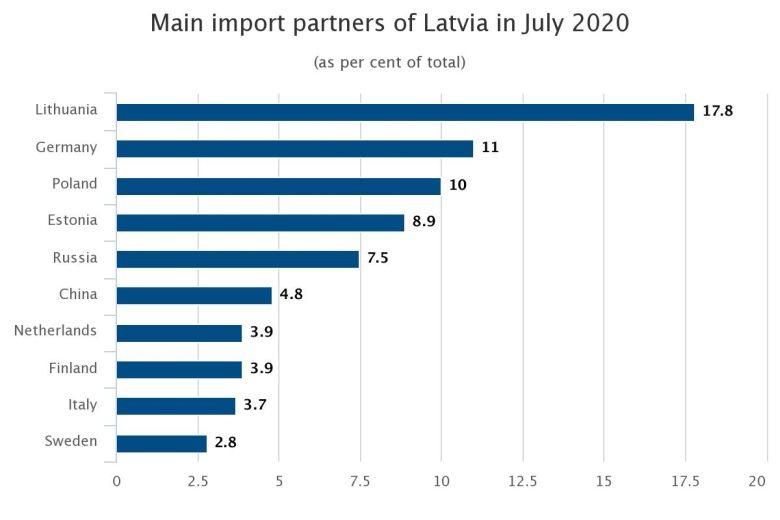
In July, the main export partners of Latvia in trade with EU countries were Lithuania (18.6 % of total exports), Estonia (13.4 %), Germany (7 %) and Sweden (5.2 %), whereas the main import partners were Lithuania (17.8 % of total imports), Germany (11 %), Poland (10 %) and Estonia (8.9 %). Russia was the main partner in trade with third countries; its share in total Latvian exports in July accounted for 8.5 %, whereas in imports – for 7.5.
In July 2020, compared to July 2019, share of the European Union countries in total exports value increased by 1.3 percentage points, but in imports value – fell by 1.3 percentage points. Share of CIS countries in exports fell by 0.6 percentage points, but in imports – by 0.5 percentage points.
Foreign trade of Latvia in July 2020 by country group (at current prices)
| Exports | Imports | ||||
| million EUR | % of total | changes as %, compared to July 2019 | million EUR | % of total | changes as %, compared to July 2019 |
Total | 1 049.8 | 100 | -0.3 | 1 329.7 | 100 | -5.9 |
European Union countries* | 720.1 | 68.6 | 1.7 | 999.4 | 75.2 | -7.5 |
euro area countries | 560.5 | 53.4 | 2.8 | 750.2 | 56.4 | -10.1 |
CIS countries | 134.1 | 12.8 | -5.3 | 145.3 | 10.9 | -10.0 |
other countries | 195.6 | 18.6 | -3.8 | 185.0 | 13.9 | 8.3 |
*The United Kingdom is not included in the European Union.
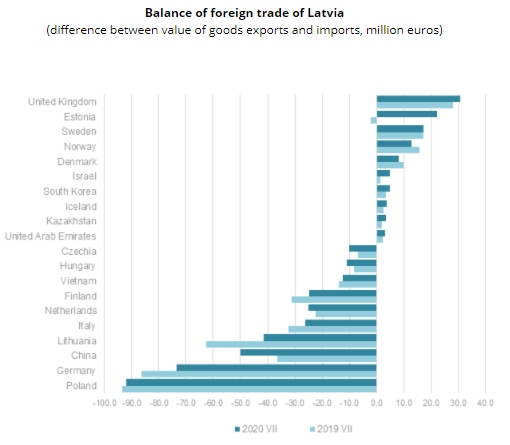
In July 2020 foreign trade balance of Latvia was positive with 122 partner countries, as exports value of goods exceeded imports value of goods. It was negative in trade with 48 countries.
The rise in exports of electrical machinery and equipment in July 2020, as compared to July 2019, was mostly facilitated by an increase in exports of boards, panels, consoles, desks and cabinets for electric control or the distribution of electricity by EUR 5.2 million or 2.9 times. In turn, reduction in exports of mineral fuels, mineral oils and products of their distillation was mostly influenced by decrease of exports of electricity by EUR 10.1 million or 58.8 %.
Main commodities in exports of Latvia in July 2020 (at current prices)
| thousand EUR | % of total | Changes as %, compared to | ||
July 2019 | June 2020 | average of previous 12 months | |||
Total | 1 049 762 | 100 | -0.3 | 7.3 | -1.1 |
184 301 | 17.6 | 4.4 | 12.0 | 5.3 | |
147 694 | 14.1 | 23.0 | 14.0 | 22.0 | |
71 795 | 6.8 | 0.2 | 15.8 | 10.2 | |
vehicles other than railway or tramway rolling stock, and parts and accessories thereof | 50 837 | 4.8 | -15.3 | 10.2 | 1.6 |
39 732 | 3.8 | -26.7 | 11.2 | -24.0 | |
38 301 | 3.6 | 1.7 | 9.0 | 3.0 | |
mineral fuels, mineral oils and products of their distillation | 35 804 | 3.4 | -28.4 | -5.8 | -14.2 |
35 248 | 3.4 | -27.1 | 22.9 | 9.9 | |
furniture, other furnishing articles; prefabricated buildings | 33 578 | 3.2 | 11.6 | 7.4 | -0.4 |
31 863 | 3.0 | -16.4 | -29.6 | -19.3 | |
The rise in imports of pharmaceutical products in July 2020, as compared to July 2019, was facilitated by an increase in imports of immunological products by EUR 3.2 million or 2 times. In turn, reduction in imports of mineral fuels, mineral oils and products of their distillation was mostly influenced by decrease in imports of diesel oil by EUR 30 million or 41.7 %.
Main commodities in imports of Latvia in July 2020 (at current prices)
| thousand EUR | % of total | Changes as %, compared to | ||
July 2019 | June 2020 | average of previous 12 months | |||
Total | 1 329 687 | 100 | -5.9 | 14.8 | 6.3 |
167 193 | 12.6 | 15.0 | 9.3 | 15.2 | |
125 521 | 9.4 | -11.6 | 8.7 | 2.9 | |
mineral fuels, mineral oils and products of their distillation | 99 741 | 7.5 | -40.3 | 29.5 | 2.7 |
vehicles other than railway or tramway rolling stock, and parts and accessories thereof | 95 527 | 7.2 | -24.9 | 19.2 | 1.6 |
58 575 | 4.4 | -3.3 | 8.6 | 11.1 | |
56 427 | 4.2 | 16.5 | 17.8 | 6.7 | |
56 311 | 4.2 | -0.6 | 31.1 | 22.1 | |
56 152 | 4.2 | 13.6 | 48.5 | 30.6 | |
47 712 | 3.6 | 14.1 | -0.4 | 5.5 | |
37 847 | 2.8 | -0.7 | 33.5 | 20.1 | |
More information on the foreign trade of Latvia by month and quarter, as well as by country group and commodity group is available in the “Foreign trade” section of the CSB database.
- 28.01.2022 BONO aims at a billion!
- 25.01.2021 Как банкиры 90-х делили «золотую милю» в Юрмале
- 30.12.2020 Накануне 25-летия Балтийский курс/The Baltic Course уходит с рынка деловых СМИ
- 30.12.2020 On the verge of its 25th anniversary, The Baltic Course leaves business media market
- 30.12.2020 Business Education Plus предлагает анонсы бизнес-обучений в январе-феврале 2021 года
- 30.12.2020 Hotels showing strong interest in providing self-isolation service
- 30.12.2020 EU to buy additional 100 mln doses of coronavirus vaccine
- 30.12.2020 ЕС закупит 100 млн. дополнительных доз вакцины Biontech и Pfizer
- 29.12.2020 В Rietumu и в этот раз создали особые праздничные открытки и календари 2021


 «The Baltic Course» Is Sold and Stays in Business!
