
Analytics, Baltic Export, Baltic States – CIS, EU – Baltic States, Foreign trade , Latvia, Markets and Companies
International Internet Magazine. Baltic States news & analytics
Friday, 13.03.2026, 21:38
In May, foreign trade turnover in Latvia fell by 24.1% y-o-y
 Print version
Compared to May 2019, foreign trade balance has improved slightly as exports in total foreign trade amount increased from 42.8 % to 46.9 %.
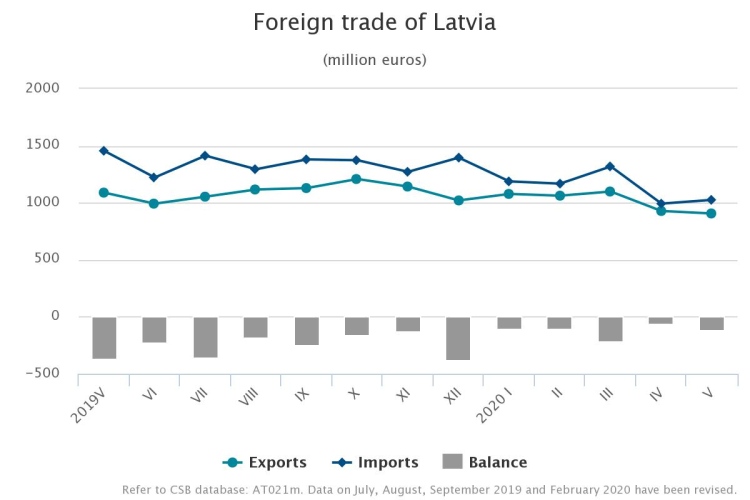
During first five months of this year foreign trade turnover of Latvia at current prices reached EUR 10.76 billion – EUR 1.08 billion or 9.1 % less than in the corresponding period of the previous year. The exports value constituted EUR 5.07 billion (a drop of EUR 217.7 million or 4.1 %), whereas the imports value comprised EUR 5.69 billion (a fall of EUR 861.6 million or 13.1 %.
Calendar and seasonally adjusted data show that, compared to May 2019, in May 2020 the exports value at current prices went down by 12 % and the imports value by 26.5 %, whereas, compared to the previous month, the exports value went up by 1.5 % ,but the imports value – by 3.6 %.
Main changes in exports in May 2020, compared to May 2019:
- exports of vehicles and associated transport equipment down by EUR 38 million or 51.2 %,
- exports of prepared foodstuffs down by EUR 22.4 million or 23 %,
- exports of base metals and articles of base metals down by EUR 21.6 million or 21 %,
- exports of mineral products down by EUR 17 million or 29.7 %,
- exports of wood and articles of wood down by EUR 14.7 million or 7.7 %.
Main changes in imports in May 2020, compared to May 2019:
- imports of vehicles and associated transport equipment down by EUR 204.9 million or 75.3 %,
- imports of mineral products down by EUR 58.5 million or 41.5 %,
- imports of products of the chemical and allied industries down by EUR 29 million or 21.1 %,
- imports of machinery and mechanical appliances; electrical equipment down by EUR 26.8 million or 10.1 %,
- imports of prepared foodstuffs down by EUR 23.8 million or 20.3 %.
In May 2020 imports of protective oral-nasal masks comprised EUR 9.7 million (a drop of EUR 1.6 million or 13.8 %. as compared to April). They mainly were imported from China (86.9 % or EUR 8.4 million). Since epidemiological crisis caused by coronavirus Covid-19 had started, demand for these goods still remains high.
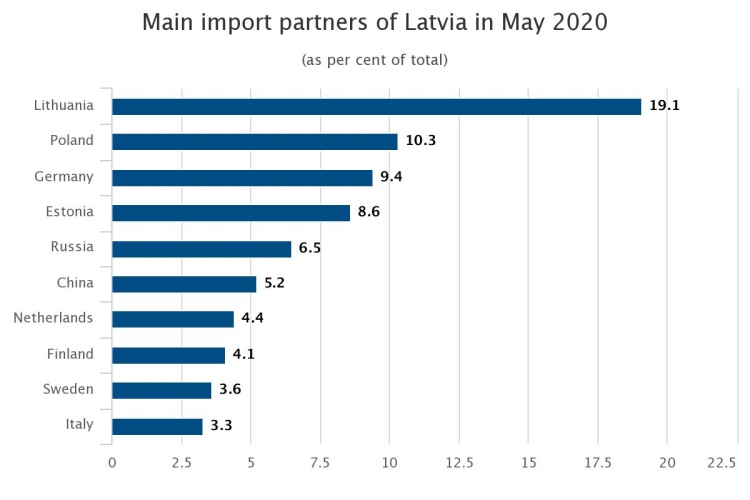
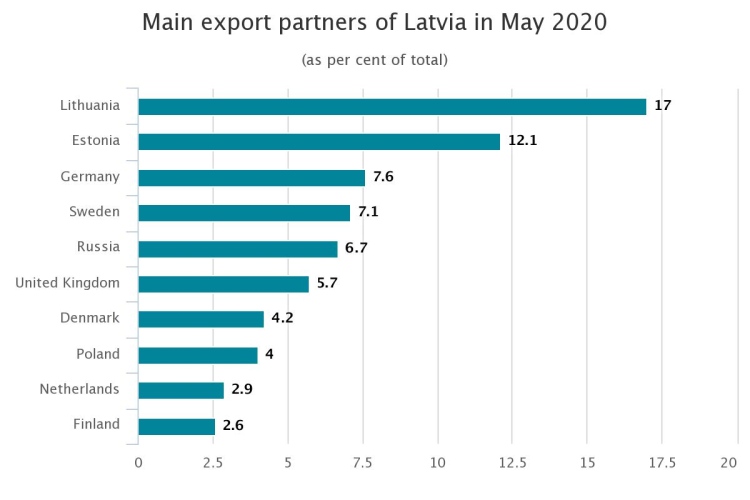
In May, the main export partners of Latvia in trade with EU countries were Lithuania (17 % of total exports), Estonia (12.1 %), Germany (7.6 %) and Sweden (7.1 %), whereas the main import partners were Lithuania (19.1 % of total imports), Poland (10.3 %), Germany (9.4 %) and Estonia (8.6 %). Russia was the main partner in trade with third countries; its share in total Latvian exports in May accounted for 6.7 %, whereas in imports – for 6.5 %.
In May 2020, compared to May 2019, share of the European Union countries in total exports value increased by 0.3 percentage points, but in imports value – by 6.1 percentage point. Share of CIS countries in exports fell by 2.2 percentage points, but in imports – increased by 0.2 percentage points.
Foreign trade of Latvia in May 2020 by country group (at current prices)
| Exports | Imports | ||||
| million EUR | % of total | changes as %, compared to May 2019 | million EUR | % of total | changes as %, compared to May 2019 |
Total | 906.1 | 100 | -16.8 | 1 025.4 | 100 | -29.6 |
European Union countries* | 623.9 | 68.8 | -16.4 | 796.0 | 77.6 | -23.5 |
euro area countries | 461.3 | 50.9 | -16.8 | 580.7 | 56.6 | -27.6 |
CIS countries | 93.5 | 10.3 | -31.2 | 104.4 | 10.2 | -28.4 |
other countries | 188.7 | 20.9 | -8.9 | 125.0 | 12.2 | -53.6 |
*The United Kingdom is not included in the European Union.
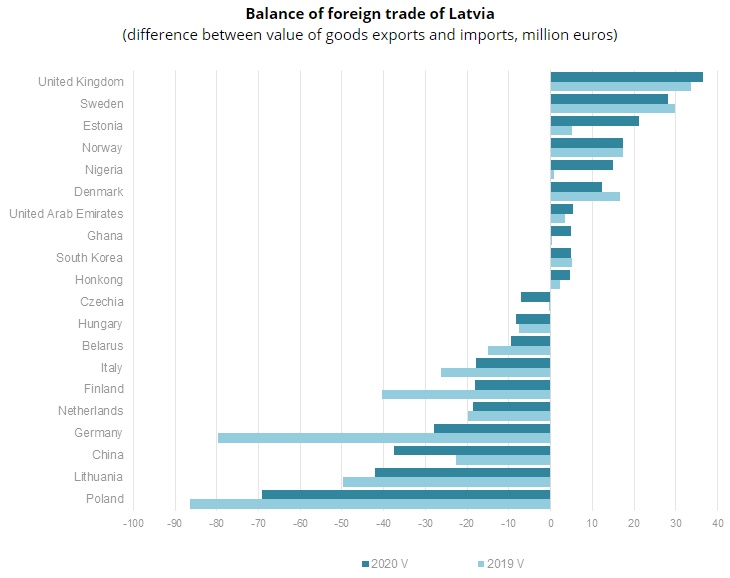
In May 2020 foreign trade balance of Latvia was positive with 110 partner countries, as exports value of goods exceeded imports value of goods. It was negative in trade with 47 countries.
The rise in exports of electrical machinery and equipment in May 2020, as compared to May 2019, was mostly facilitated by an increase in exports of monitors, projectors and television reception apparatus by EUR 5 million or 52.2 %. In turn, reduction in exports of vehicles and associated transport equipment was mostly affected by drop in exports of passenger cars by EUR 17.5 million or 60.7 %.
Main commodities in exports of Latvia in May 2020
(at current prices)
| Thousand EUR | % of total | Changes as %, compared to | ||
May 2019 | April 2020 | average of previous 12 months | |||
Total | 906 124 | 100.0 | -16.8 | -2.3 | -15.8 |
175 758 | 19.4 | -7.8 | 0.7 | -0.9 | |
118 739 | 13.1 | 3.7 | 15.6 | 0.6 | |
55 729 | 6.2 | -12.8 | -9.9 | -15.3 | |
35 733 | 3.9 | -11.5 | -4.8 | -5.4 | |
mineral fuels, mineral oils and products of their distillation | 34 357 | 3.8 | -32.6 | 14.5 | -22.5 |
vehicles other than railway or tramway rolling stock, and parts and accessories thereof | 32 313 | 3.6 | -51.9 | 29.2 | -39.9 |
30 287 | 3.3 | -25.2 | -22.4 | -23.2 | |
furniture, other furnishing articles; prefabricated buildings | 29 255 | 3.2 | -13.4 | -7.3 | -13.3 |
28 111 | 3.1 | -43.9 | -12.3 | -48.5 | |
26 607 | 2.9 | -16.8 | -9.3 | -9.8 | |
Also the rise in imports of electrical machinery and equipment in May 2020, as compared to May 2019, was mostly facilitated by an increase in imports of monitors, projectors and television reception apparatus by EUR 3.7 million or 42.4 %. In turn, reduction in imports of vehicles and associated transport equipment was mostly affected by drop in imports of passenger cars by EUR 46.5 million or 72.8 %.
Main commodities in imports of Latvia in May 2020 (at current prices)
| thousand EUR | % of total | Changes as %, compared to | ||
May 2019 | April 2020 | average of previous 12 months | |||
Total | 1 025 392 | 100.0 | -29.6 | 3.3 | -20.5 |
129 130 | 12.6 | 3.3 | 19.1 | -9.0 | |
108 328 | 10.6 | -22.2 | -9.0 | -13.5 | |
mineral fuels, mineral oils and products of their distillation | 78 229 | 7.6 | -41.9 | 41.4 | -27.2 |
vehicles other than railway or tramway rolling stock, and parts and accessories thereof | 64 092 | 6.3 | -53.7 | 48.8 | -37.6 |
51 867 | 5.1 | -18.0 | -0.5 | -3.0 | |
47 707 | 4.7 | -12.3 | -5.0 | -9.6 | |
43 484 | 4.2 | -12.5 | 7.1 | -4.5 | |
37 804 | 3.7 | -16.1 | -13.1 | -12.1 | |
32 136 | 3.1 | -37.1 | 6.9 | -33.5 | |
26 420 | 2.6 | -21.5 | 0.2 | -19.4 | |
- 28.01.2022 BONO aims at a billion!
- 26.08.2021 LLC Dizozols Investments finalizes investment attraction deal with Crowdestor with record-high profits
- 25.01.2021 Как банкиры 90-х делили «золотую милю» в Юрмале
- 30.12.2020 Накануне 25-летия Балтийский курс/The Baltic Course уходит с рынка деловых СМИ
- 30.12.2020 On the verge of its 25th anniversary, The Baltic Course leaves business media market
- 30.12.2020 Business Education Plus предлагает анонсы бизнес-обучений в январе-феврале 2021 года
- 30.12.2020 Hotels showing strong interest in providing self-isolation service
- 30.12.2020 EU to buy additional 100 mln doses of coronavirus vaccine
- 30.12.2020 ЕС закупит 100 млн. дополнительных доз вакцины Biontech и Pfizer
- 29.12.2020 В Rietumu и в этот раз создали особые праздничные открытки и календари 2021


 «The Baltic Course» Is Sold and Stays in Business!
