
Analytics, Energy, Latvia, Markets and Companies, Transport
International Internet Magazine. Baltic States news & analytics
Monday, 25.05.2026, 12:44
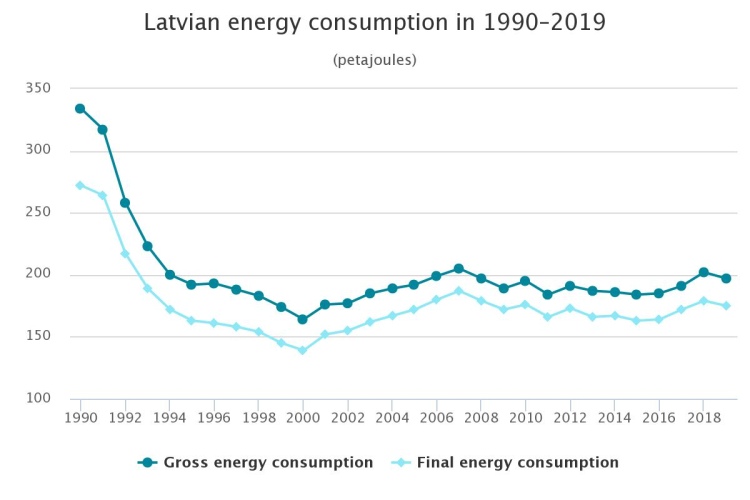
In 2019, gross energy consumption in Latvia declined by 2.4%
 Print version
Amount of electricity produced in hydro and wind power plants up by 26%
Compared to 2018, in 2019 the amount of renewables produced dropped by 6.6%. Due to reconstruction of an enterprise having significant share in the sector, amount of bioethanol produced fell by 89%. Primary electricity production2 fell by 11.4% or 1.0 PJ, of which by 13.4% in hydro power plants. In 2019, solar power plants produced three times more electricity than in 2018 and wind power plants 24.6% more electricity. Hydro power plants and wind power plants together produced 2 259 GWh of electricity – 2 107 GWh and 152 GWh, respectively.
The small amount of electricity generated in hydro power plants resulting from the small water inflow had the greatest downward effect on the amount of electricity produced last year.
Share of renewables in gross energy consumption is growing
Over the recent years, the structure of gross energy consumption has changed – as the share of natural gas is declining and the proportion of renewables is growing. Over the past ten years (from 2010 to 2019), the share of natural gas consumption has gone down by 8 percentage points, constituting 23.5% in 2019, whereas the share of renweables has reached 35.5%. In 2019, the share of oil products in the gross energy consumption accounted for 40%, while the share of other energy resources constituted 1%. At the same time, share of firewood consumption grew by 8 percentage points over the past decade, constituting 31.4% in 2019. Compared to 2018, in 2019 the amount of wood chips and pelleted wood produced rose by 5.8% and 29.5%, respectively. During the period, exports of pelleted wood rose by 28.7%, while over the past five years by 42.5% (from 27 954 TJ to 39 831 TJ).
As the gross consumption of renewables is increasing, Latvia has accomplished its strategic objective regarding use of renewable energy resources aiming at reaching 40% of the energy produced from renewables in the gross final energy consumption until 2020. Latvia has the third highest share of renewables in the final energy consumption in the European Union (EU); in 2018, the indicator constituted 40.3% (EU average 18%). The EU Member States shall ensure that until 2020 the share of renewables consumed in transport sector is 10%. In 2018, Latvian share of renewables in transport constituted 4.7% and EU average 8%.
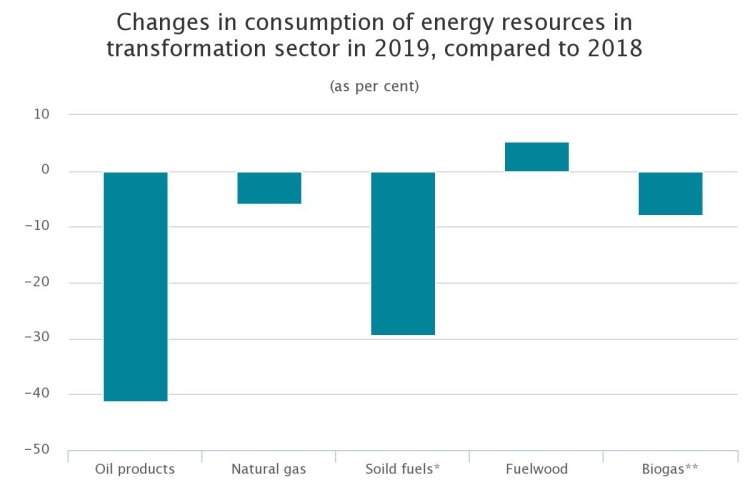
Rise in consumption of renewables in transformation sector
In 2019, 56.1 PJ of energy resources were consumed for production of heat and electricity in transformation sector3 and 43.6 PJ of energy were produced (of which 28.6 PJ of heat and 15.0 PJ of electricity), which is 2.4% less than in 2018. Hot and dry weather hindered Latvian hydro power plants from producing the electricity amount needed, which, in turn, facilitated rise in the consumption of renewables in transformation sector. Production of heat and electricity in Latvia mainly is based on fossil fuel – natural gas, the share thereof in transformation sector has been decreasing gradually: 81% in 2010, 57.8% in 2018 and 55.6% in 2019. Over the past five years, the share of renewables consumed in transformation sector has risen by 7.9 percentage points reaching 44% in 2019. It may be assessed as a positive trend, bearing in mind that the renewables used in transformation sector are local resources firewood, biogas, and other biomass.
In 2019, final energy consumption constituted 174.9 PJ, which is 2.3% less than in 2018. Over the past ten years, no notable changes were recorded in the final energy consumption. Last year, transport sector consuming 31.0% of the energy resources, households (28.4%) and industry (21.9%) were the largest consumers of energy sources. Compared to 2018, last year increase in final consumption of energy resources was recorded in transport sector (of 0.1%) as well as agriculture and forestry (of 11.6%), whereas decline was registered in industry (of 5.7%) and household sector (3.5%), as well as fishing (13.1%) and other consumers (3.9%).
Electricity consumption in transport sector up by 54.5%
Over the past five years, consumption of energy resources in transport sector has gone up by 10.8%, reaching 54.3 PJ in 2019. The sector takes approximately one third of the Latvian consumption of energy resources and almost fully is based on oil imports, as the share of electricity and biofuel in the sector is comparatively small. Diesel oil is the main energy resource used in the transport sector, and the share thereof constituted 64.7% in 2019.
During the recent years, significant increase in the share of liquefied petroleum gas (LPG) consumed in transport sector may be observed. In 2010, the indicator constituted 1 PJ, whereas in 2019 – 2.0 PJ or two times more. In its turn, compared to 2018, consumption of LPG has dropped by 12.3%.
Over the past five years, consumption of motor petrol in transport sector declined by 14.8%, reaching 7.3 PJ in 2019, which is 5.1% less than in 2018.
In 2019, consumption of electricity in transport sector constituted 577 GWh, which is 54.3% more than in 2018 (374 GWh). The increase was facilitated by the introduction of electric buses in public transport as well as rise in number of light electric vehicles registered in Latvia.
Consumption of energy resources in industry down by 5.7%
Over the past five years, consumption of energy resources in industry has gone up by 4.3%, however comparison with 2018 shows a reduction of 5.7% (in 2019 the indicator constituted 38.4 PJ).
In 2019, the greatest consumption of energy resources was recorded in manufacture of wood and of products of wood and cork – 20.7 PJ or 53.8% of the final energy consumption in industry.
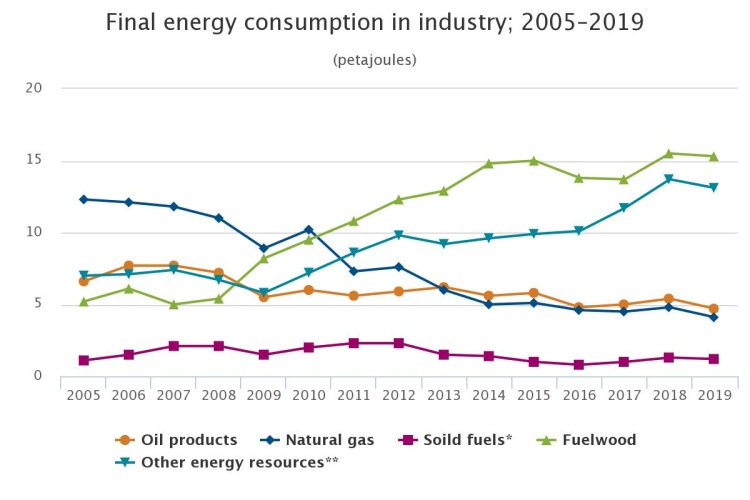
During the last five years, consumption of oil products in industry has went down by 10.8%, while consumption of renewables has grown by 5.8%.
In 2019, final energy consumption in manufacture of rubber and manufacture of furniture amounted to 1 376 TJ, which is 39.2% less than in 2018 (2 264 TJ).
Decline in natural gas consumption in household sector
In 2019, consumption of energy resources in households amounted to 49.7 PJ, which is 3.5% less than in 2018. Structure of energy resource consumption in households has not changed notably over the recent years – firewood is the most commonly used energy resource. Compared to 2018, consumption of natural gas in households has dropped by 7.0% and consumption of coal by 29.3% (from 276 TJ to 195 TJ).
Methodological explanations
1 Gross consumption of energy resources includes consumption of energy resources in heat and electricity production sector (transformation sector), and final consumption, which includes all sectors of national economy, as well as households.
2 Primary electricity production covers production of electricity in hydro power plants, wind power plants, solar power plants and by solar micro-generators.
3 Transformation sector includes the volume of energy resources produced for sale.
- 28.01.2022 BONO aims at a billion!
- 25.01.2021 Как банкиры 90-х делили «золотую милю» в Юрмале
- 30.12.2020 Накануне 25-летия Балтийский курс/The Baltic Course уходит с рынка деловых СМИ
- 30.12.2020 On the verge of its 25th anniversary, The Baltic Course leaves business media market
- 30.12.2020 Business Education Plus предлагает анонсы бизнес-обучений в январе-феврале 2021 года
- 30.12.2020 Hotels showing strong interest in providing self-isolation service
- 30.12.2020 EU to buy additional 100 mln doses of coronavirus vaccine
- 30.12.2020 ЕС закупит 100 млн. дополнительных доз вакцины Biontech и Pfizer
- 29.12.2020 В Rietumu и в этот раз создали особые праздничные открытки и календари 2021
- 29.12.2020 Latvia to impose curfew, state of emergency to be extended until February 7


 «The Baltic Course» Is Sold and Stays in Business!
