
Analytics, Baltic, Employment, Latvia, Statistics
International Internet Magazine. Baltic States news & analytics
Tuesday, 31.03.2026, 18:38
In 2019, 65% of the population of Latvia were employed
 Print version
Compared to 2018, employment rate grew by 0.5 percentage points and number of employed persons by 0.6 thousand.
Higher rise in the number of employed persons was registered in construction, financial and insurance activities, public administration and defence; compulsory social security, as well as agriculture, forestry and fishing.
Last year, 3.6 thousand employed persons participated in complex support activities organised by the State Employment Agency, e.g., had paid temporary community work while still having the status of unemployed.
In the 4th quarter of 2019, 913.1 thousand people aged 15–74 were employed in Latvia, which is 4.7 thousand people fewer than in the 3rd quarter. Employment rate constituted 65.4%, which is 0.2 percentage points lower than in the 3rd quarter.
Nevertheless since the 4th quarter of 2012 Latvian employment rate exceeds the European Union (EU) average1 (in the 3rd quarter of 2019 it constituted 61.2%), in the 4th quarter it was the lowest among the Baltic states – employment rate in Estonia constituted 69.2% and in Lithuania 65.7%.
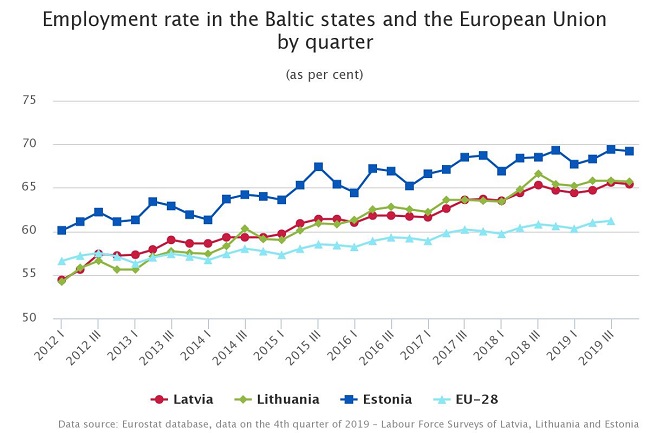
Data source: Eurostat database, data on the 4th quarter of 2019 – Labour Force Surveys of Latvia, Lithuania and Estonia.
In 2019, employment rate among young people (aged 15–24) constituted 31.8%, which is 1.3 percentage points lower indicator than that recorded in 2018. The number of employed young people accounted for 54.5 thousand (57.4 thousand in 2018). Compared to the 3rd quarter, in the 4th quarter number of employed young people grew by 0.7 thousand or 1.2 % and constituted 57.1 thousand.
Last year, persons in main job worked on average 37.9 hours per week – 0.4 hours fewer than in 2018. In the 4th quarter of 2019, persons in main job worked on average 37.8 hours per week, which is 0.8 hours fewer than in the 3rd quarter.
Compared to 2018, in 2019 the share of employees receiving EUR 700–1400 grew by 4.2 percentage points (and constituted 29.9 %), whereas share of employees receiving more than EUR 1400 rose by 1.2 percentage points (and constituted 5.3%). Share of employees receiving EUR 450 monthly after taxes fell to 25.8% (drop of 4.7 percentage points), the proportion of employees receiving minimum monthly wage2 or less accounted for 14.4% or 116.0 thousand people (a reduction of 2.5 percentage points over the year). In 2019, the highest share of people receiving lowest wages was still recorded in Latgale, where 23.6% of the employees received minimum wage or less. In 2019, wage or salary of 2.7% of employees was not calculated or paid, while 2.3% did not indicate the size of earnings thereof.
In the 4th quarter of 2019, compared to the 3rd quarter, the share of employees receiving less than EUR 450 monthly (after taxes) rose to 23.7% (increase of 0.7 percentage points), the proportion of employees receiving minimum monthly wage or less constituted or 14.3% or 115.6 thousand people (upturn of 1.9 percentage points, compared to the 3rd quarter of 2019).
Employees
by monthly net wages and salaries in the main job
(as per cent)
|
|
2018 |
2019 |
2019 |
|||
|
Q1 |
Q2 |
Q3 |
Q4 |
|||
|
Employees |
100.0 |
100.0 |
100.0 |
100.0 |
100.0 |
100.0 |
|
up to EUR 450.00 |
30.5 |
25.8 |
29.0 |
27.7 |
23.0 |
23.7 |
|
employees receiving minimum monthly wage or less |
16.9 |
14.4 |
15.3 |
15.6 |
12.4 |
14.3 |
|
EUR 450.01–700.00 |
34.4 |
34.0 |
34.8 |
31.5 |
34.3 |
35.3 |
|
EUR 700.01-1400.00 |
25.7 |
29.9 |
26.4 |
30.2 |
31.8 |
31.1 |
|
EUR 1400.01 and more |
4.1 |
5.3 |
4.4 |
5.3 |
5.9 |
5.5 |
|
was not calculated or paid |
2.6 |
2.7 |
2.8 |
2.9 |
2.4 |
2.6 |
|
not specified |
2.7 |
2.3 |
2.6 |
2.4 |
2.6 |
1.8 |
In 2019, Labour Force Survey questions about economic activity were asked to 27.9 thousand people aged 15–74 living in 16.0 thousand households, while in the 4th quarter – to 6.9 thousand people aged 15–74 living in 3.9 thousand households.
- 28.01.2022 BONO aims at a billion!
- 25.01.2021 Как банкиры 90-х делили «золотую милю» в Юрмале
- 30.12.2020 Накануне 25-летия Балтийский курс/The Baltic Course уходит с рынка деловых СМИ
- 30.12.2020 On the verge of its 25th anniversary, The Baltic Course leaves business media market
- 30.12.2020 Business Education Plus предлагает анонсы бизнес-обучений в январе-феврале 2021 года
- 30.12.2020 Hotels showing strong interest in providing self-isolation service
- 29.12.2020 В Латвии вводят комендантский час, ЧС продлена до 7 февраля
- 29.12.2020 В Rietumu и в этот раз создали особые праздничные открытки и календари 2021
- 29.12.2020 Latvia to impose curfew, state of emergency to be extended until February 7
- 29.12.2020 18-19 января Наталия Сафонова проводит семинар "Управленческий учет во власти собственника"


 «The Baltic Course» Is Sold and Stays in Business!