
Analytics, Foreign trade , Latvia, Statistics
International Internet Magazine. Baltic States news & analytics
Friday, 20.03.2026, 06:24
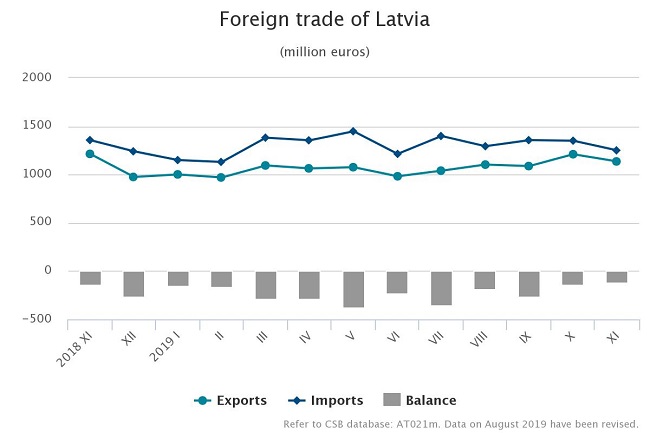
In November foreign trade turnover of Latvia was 7.2% smaller than a year ago
 Print version
In November, Latvia exported
goods in the amount of EUR 1.14 bn, but imported in the amount of
EUR 1.25 bn. Compared to November 2018, foreign trade
balance has improved slightly as exports in total foreign trade amount increased
from 47.2% to 47.6%.
Over the
eleven months of this year, the foreign trade turnover of Latvia at current
prices reached EUR 26.08 bn – EUR 239.4 mln or 0.9% less
than in the corresponding period of 2018. The exports value constituted
EUR 11.76 bn (a decrease of EUR 10.7 mln or 0.1%), whereas
the imports value – EUR 14.32 bn (a drop of EUR 228.7 mln
or 1.6%).
Calendar
and seasonally adjusted data show that, compared to November 2018, in
November 2019 the exports value at current prices went down by 3.2% and
the imports value by 5.1%, whereas, compared to the previous month, the exports
value went up by 0.2% and the imports value – by 1.1%.
Main
changes in exports in November 2019, compared to November 2018:
- exports of vegetable products up by EUR 31.8 mln or 46.6%,
- exports
of machinery and mechanical appliances; electrical equipment down by
EUR 41.4 mln or 17.6%,
- exports of wood and articles of wood down by
EUR 30.7 mln or 15.2%,
- exports of vehicles and associated transport equipment down by
EUR 22.6 mln or 28%,
- exports of mineral products down by EUR 16.6 mln or
24.6%.
Main
changes in imports in November 2019, compared to November 2018:
- imports of prepared foodstuffs up by EUR 6.7 mln or 5.5%,
- imports of mineral products down by EUR 42.7 mln or
30.6%,
- imports of machinery and mechanical appliances;
electrical equipment down by EUR 24.8 mln or 8.2%,
- imports of basic metals and articles of basic metals down by
EUR 17.9 mln or 15.8%,
- imports of vehicles and associated transport equipment down by
EUR 13.6 mln or 10.8%.
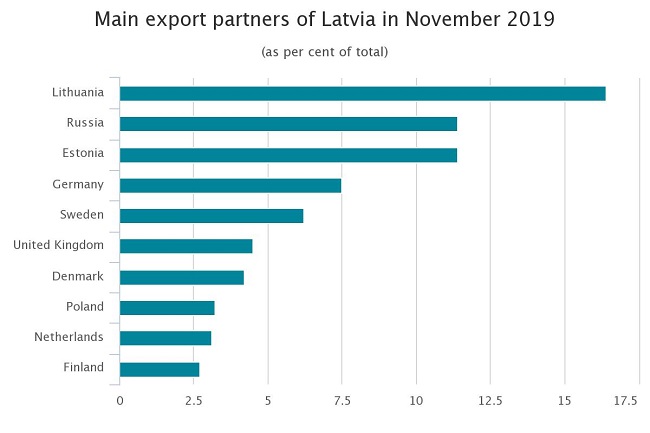
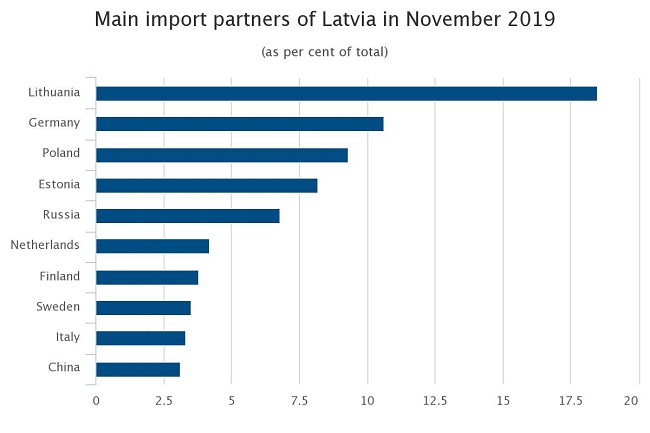
In
November, the main export partners of Latvia in trade with EU countries were
Lithuania (16.4% of total exports), Estonia (11.4%), Germany (7.5%) and Sweden
(6.2%), whereas the main import partners were Lithuania (18.5% of total
imports), Germany (10.6%), Poland (9.3%) and Estonia (8.2%). Russia was the
main partner in trade with third countries; its share in total Latvian exports
in November accounted for 11.4%, whereas in imports – for 6.8%.
In November 2019, compared to November 2018, share
of the European Union countries in total exports value fell by
0.1 percentage point, but in imports value – grew by 1.5 percentage
points. Rise in share of CIS countries comprised 1.3 percentage points in
exports and drop of 1 percentage point in imports.
Foreign
trade of Latvia by country group in November 2019
(at current prices)
|
|
Exports |
Imports |
||||
|
|
million EUR |
%
of total |
changes
as %, compared to November 2018 |
million EUR |
%
of total |
changes
as %, compared to November 2018 |
|
Total |
1 135.3 |
100 |
-6.5 |
1 250.1 |
100 |
-7.8 |
|
European Union countries |
798.8 |
70.4 |
-6.6 |
995.2 |
79.6 |
-6.0 |
|
euro area countries |
566.7 |
49.9 |
0.9 |
723.0 |
57.8 |
-7.2 |
|
CIS countries |
182.1 |
16.0 |
1.9 |
127.0 |
10.2 |
-16.7 |
|
other countries |
154.4 |
13.6 |
-14.0 |
127.9 |
10.2 |
-11.6 |
In November 2019 foreign trade balance of Latvia was
positive with 127 partner countries, as exports value of goods exceeded
imports value of goods. It was negative in trade with 47 countries.
Rise of exports of oil seeds, oleaginous fruits in
November 2019, as compared to November 2018, was affected by the
increase in exports of rape and colza seeds of EUR 23.4 mln or
2.8 times. In turn, reduction in exports of machinery and mechanical
appliances; electrical equipment was mostly influenced by decrease of exports
of turbojets by EUR 20.8 mln.
Main
commodities in exports of Latvia in November 2019
(at current prices)
|
|
thousand EUR |
as %
of total |
Changes
as %, compared to |
||
|
November 2018 |
October
2019 |
average
of previous 12 months |
|||
|
Total |
1 135 330 |
100 |
-6.5 |
-6.2 |
6.3 |
|
170 531 |
15.0 |
-15.3 |
-6.8 |
-8.9 |
|
|
127 208 |
11.2 |
-4.8 |
-0.5 |
12.9 |
|
|
81 534 |
7.2 |
4.0 |
2.7 |
50.0 |
|
|
66 267 |
5.8 |
-34.6 |
1.1 |
2.2 |
|
|
vehicles
other than railway or tramway rolling stock, and parts and accessories
thereof |
53 600 |
4.7 |
-26.2 |
-13.3 |
-10.5 |
|
mineral
fuels, mineral oils and products of their distillation |
44 415 |
3.9 |
-27.7 |
0.9 |
-12.8 |
|
39 510 |
3.5 |
-0.1 |
-27.8 |
-2.9 |
|
|
38 981 |
3.4 |
2.6 times |
3.6 times |
4.2 times |
|
|
38 499 |
3.4 |
0.9 |
-1.2 |
4.3 |
|
|
furniture,
other furnishing articles; prefabricated buildings |
38 057 |
3.4 |
16.4 |
-2.3 |
22.8 |
Rise of imports of electrical machinery and equipment in
November 2019, as compared to November 2018, was mostly affected by
the increase in imports of electronic integrated circuits of EUR 2.8 mln
or 36.7%. In turn, reduction in imports of mineral fuels, mineral oils and
products of their distillation was mostly influenced by decrease of imports of
diesel oil by EUR 15.7 mln or 27.2%.
Main
commodities in imports of Latvia in November 2019
(at current prices)
|
|
thousand EUR |
as %
of total |
Changes
as %, compared to |
||
|
November 2018 |
October
2019 |
average
of previous 12 months |
|||
|
Total |
1 250 097 |
100 |
-7.8 |
-7.4 |
-4.3 |
|
163 798 |
13.1 |
3.0 |
0.9 |
20.8 |
|
|
115 368 |
9.2 |
-20.4 |
-7.6 |
-10.2 |
|
|
vehicles other than railway or tramway rolling stock, and
parts and accessories thereof |
97 259 |
7.8 |
-19.3 |
-7.6 |
-12.0 |
|
mineral fuels, mineral oils and products of their
distillation |
92 752 |
7.4 |
-31.6 |
-24.5 |
-23.1 |
|
51 122 |
4.1 |
-2.8 |
-13.9 |
-4.1 |
|
|
49 309 |
3.9 |
-9.2 |
-15.6 |
0.3 |
|
|
48 160 |
3.9 |
-13.4 |
-2.4 |
-0.2 |
|
|
47 772 |
3.8 |
-11.0 |
-13.4 |
-10.5 |
|
|
39 831 |
3.2 |
-27.7 |
-20.1 |
-16.9 |
|
|
32 778 |
2.6 |
1.0 |
-0.8 |
1.1 |
|
- 28.01.2022 BONO aims at a billion!
- 25.01.2021 Как банкиры 90-х делили «золотую милю» в Юрмале
- 30.12.2020 Накануне 25-летия Балтийский курс/The Baltic Course уходит с рынка деловых СМИ
- 30.12.2020 On the verge of its 25th anniversary, The Baltic Course leaves business media market
- 30.12.2020 Business Education Plus предлагает анонсы бизнес-обучений в январе-феврале 2021 года
- 30.12.2020 Hotels showing strong interest in providing self-isolation service
- 29.12.2020 В Латвии вводят комендантский час, ЧС продлена до 7 февраля
- 29.12.2020 В Rietumu и в этот раз создали особые праздничные открытки и календари 2021
- 29.12.2020 Latvia to impose curfew, state of emergency to be extended until February 7
- 29.12.2020 18-19 января Наталия Сафонова проводит семинар "Управленческий учет во власти собственника"


 «The Baltic Course» Is Sold and Stays in Business!