
Analytics, Covid-19, Good for Business, Industry, Latvia, Markets and Companies
International Internet Magazine. Baltic States news & analytics
Friday, 26.04.2024, 11:45
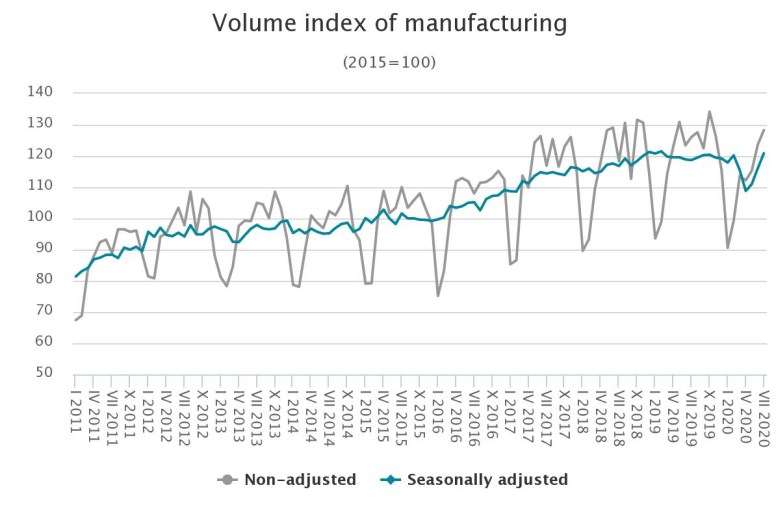
In July, manufacturing has reached the best result of 2020 in Latvia
 Print version
Compared to the corresponding month of the previous year, production output rise was in the sector having the largest share in industrial production – manufacture of wood, and of products of wood and cork (of 12.5 %). In July production output continued to increase in manufacture of chemicals and chemical products – by 13.7 %, and manufacture of computer, electronic and optical products. As negative impact of COVID-19 reduced, production output growth was registered in manufacture of machinery and equipment (of 11.9 %), manufacture of furniture (10.5 %) and manufacture of wearing apparel (9.1 %).
However, production output fall remained in repair and installation of machinery and equipment (of 26.5 %) and manufacture of motor vehicles, trailers and semi-trailers (manufacture of motor vehicle parts and accessories, which includes various components of motor vehicles) (16.8 %). Production output also declined in manufacture of basic pharmaceutical products and pharmaceutical preparations, manufacture of metal products and two out of the three sectors having the largest share in industrial production: manufacture of food products and manufacture of fabricated metal products, except machinery and equipment (of 0.2 % and 15.5 %, respectively).
Compared to June 2020, in July 2020, manufacturing production output rose by 4.1 % (according to seasonal adjusted data at constant prices). Production output increase was also in mining and quarrying (of 0.3 %), but in electricity and gas supply there was a drop (27.1 %). Total industrial production output decreased by 0.8 %.
Changes in industrial production output (as per cent, at constant prices)
| January – July 2020, compared to January – July 2019 (calendar adjusted) | July 2020, compared to | |
June 2020 (seasonally adjusted) | July 2019 (calendar adjusted) | ||
Total industrial production | -3.2 | -0.8 | 0.1 |
Mining and quarrying | 4.9 | 0.3 | 11.5 |
Manufacturing | -3.5 | 4.1 | 1.8 |
Manufacture of food products | -1.0 | 0.7 | -0.2 |
Manufacture of beverages | -7.3 | -3.3 | -0.1 |
Manufacture of textiles | -12.9 | 9.1 | -10.8 |
Manufacture of wearing apparel | -13.3 | 30.7 | 9.1 |
Manufacture of wood and of products of wood and cork, except furniture | -0.2 | 8.9 | 12.5 |
Manufacture of paper and paper products | 2.5 | -1.6 | 0.8 |
Printing and reproduction of recorded media | 3.3 | 6.0 | 7.3 |
Manufacture of chemicals and chemical products | 10.1 | -8.7 | 13.7 |
Manufacture of other non-metallic mineral products | -1.4 | 0.7 | -1.2 |
Manufacture of fabricated metal products, except machinery and equipment | -4.2 | -7.3 | -15.5 |
Manufacture of electrical equipment | 4.5 | 1.7 | 6.6 |
Manufacture of machinery and equipment | -9.1 | 25.6 | 11.9 |
Manufacture of motor vehicles, trailers and semi-trailers | -25.1 | 7.5 | -16.8 |
Manufacture of furniture | -3.4 | 11.4 | 10.5 |
Repair and installation of machinery and equipment* | -27.6 | 13.9 | -26.5 |
Electricity and gas supply | -3.5 | -27.1 | -14.1 |
* Repair and maintenance of ships and boats, repair of fabricated metal products, machinery and equipment, installation of industrial machinery and equipment.
Manufacturing turnover (2)
Compared to July 2019, in July 2020, manufacturing turnover, according to calendar adjusted data at current prices, rose by 5.5 %, export turnover – by 9.8 % (of which by 14.6 % in euro area and by 5.6 % in non-euro area), but turnover on the domestic market – fell by 1.5 %.
Compared to June 2020, in July 2020 manufacturing turnover, according to seasonally adjusted data, rose by 4.2 %. Turnover on the domestic market increased by 0.4 % and export turnover – by 6.2 % (of which by 12.1 % in euro area and by 1.6 % in non-euro area).
Methodological explanations
1. The volume index of industrial production describes changes in the volume of industrial production during the reference period in comparison to the base period. The index is estimated by recalculating the production output indicator at constant prices with the help of producer price indices.
2. The industrial turnover index measures the monthly development of market demand for industrial goods and services. It is calculated at current prices without excluding price influence. Unlike industrial goods that also include unfinished goods and goods in stock, turnover only includes the goods sold and industrial services provided.
- 28.01.2022 BONO aims at a billion!
- 13.02.2021 Моя жизнь в газете. Очерки по новейшей истории Латвии. Глава 1
- 25.01.2021 Как банкиры 90-х делили «золотую милю» в Юрмале
- 30.12.2020 Накануне 25-летия Балтийский курс/The Baltic Course уходит с рынка деловых СМИ
- 30.12.2020 On the verge of its 25th anniversary, The Baltic Course leaves business media market
- 30.12.2020 Business Education Plus предлагает анонсы бизнес-обучений в январе-феврале 2021 года
- 30.12.2020 Hotels showing strong interest in providing self-isolation service
- 30.12.2020 EU to buy additional 100 mln doses of coronavirus vaccine
- 30.12.2020 ЕС закупит 100 млн. дополнительных доз вакцины Biontech и Pfizer
- 29.12.2020 В Rietumu и в этот раз создали особые праздничные открытки и календари 2021


 «The Baltic Course» Is Sold and Stays in Business!
