
Analytics, Baltic Export, Foreign trade , Latvia
International Internet Magazine. Baltic States news & analytics
Friday, 26.04.2024, 07:35
Exports value in Latvia decreased by 3.8%, imports – by 0.2% in June
 Print version
The foreign trade balance slightly worsened in June as exports in total foreign trade value declined to 44.1% (in May 2014 – 45.0%).
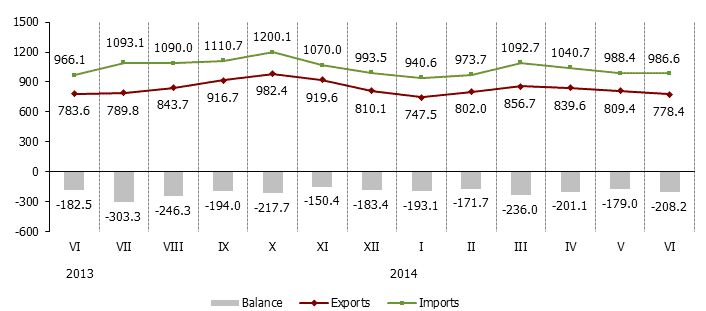 |
| Foreign trade of Latvia, in mln euros (1) |
Data source: Central Statistical Bureau of Latvia
Despite the foreign trade turnover downturn in June, as compared to May exports of prepared foodstuffs rose by 6.7 mln euros or 10.5%. The most rapid growth was recorded in exports to Russia – of 6.9 mln euros or 31.1% (mainly of spirits – of 5.1 mln euros), as well as in exports to Ireland – of 0.6 mln euros or 4.8 times (mainly of bran and middlings). In turn, imports of prepared foodstuffs rose by 6.6 mln euros or 8.8%: from Poland by 2.5 mln euros or 28.2% (mainly of food preparations of flour) and from Germany – by 1.6 mln euros or 28.7% (mainly of spirits).
On 7 August 2014 Russia imposed a ban on imports of certain foodstuffs from the EU and other countries. In the first half of 2014 the total value of exports of these goods to Russia accounted for 38.5 mln euros or 8.1% (in the first half of 2013, 17.5 mln euros or 3.5%). More information on how the food import embargo imposed by Russia impacts the Latvian exports will be published in a separate press release.
Main changes in exports in June (compared to May):
· exports of basic metals and articles of basic metals decreased by 26.8 mln euros or 26.2%;
· exports of wood and articles of wood dropped by 9.2 mln euros or 6.0%;
· exports of products of the chemical and allied industries grew by 9.6 mln euros or 16.3%.
Main changes in imports in June (compared to May):
· imports of products of the chemical and allied industries declined by 10.1 mln euros or 9.2%;
· imports of live animals and animal products decreased by 4.1 mln euros or 10.8%;
· imports of vehicles, aircraft, vessels and associated transport equipment increased by 10.0 mln euros or 14.0%.
Foreign trade of Latvia by country group in June 2014, at current prices
|
|
Exports |
Imports |
||||
|
|
mln euros |
% of total |
in % (+, –) over May 2014 |
mln euros |
% of total |
in % (+, –) over May 2014 |
|
Total |
778.4 |
100 |
-3.8 |
986.6 |
100 |
-0.2 |
|
Member States of the European Union |
560.2 |
72.0 |
-5.9 |
793.2 |
80.4 |
-1.5 |
|
Euro area countries |
242.3 |
31.1 |
-5.6 |
408.5 |
41.4 |
+0.4 |
|
CIS countries |
121.8 |
15.6 |
+11.9 |
115.0 |
11.7 |
+4.5 |
|
Other countries |
96.4 |
12.4 |
-8.6 |
78.4 |
7.9 |
+7.5 |
In June the main export partners were Lithuania (18.2% of total export), Estonia (11.8%), Germany (7.1%) and Poland (5.9%); the main import partners were Lithuania (17.2% of total import), Poland (11.7%), Germany (11.3%) and Estonia (7.6%). Share of exports in trade with Russia comprised 11.3%, but in imports – 7.2%.
Changes of main commodities in Latvia’s exports in June 2014, at current prices
|
|
thsd euros |
% of total |
% (+, –) over |
||
|
June 2013 |
May 2014 |
average of previous 12 months |
|||
|
Total |
778 365 |
100 |
-0.7 |
-3.8 |
-7.5 |
|
wood and wood products; wood charcoal |
144 075 |
18.5 |
+11.2 |
-6.0 |
+3.5 |
|
electrical machinery and equipment |
80 582 |
10.4 |
-1.7 |
-7.3 |
-7.3 |
|
mineral fuels, mineral oils and products of their distillation |
55 707 |
7.2 |
-3.7 |
-7.2 |
-17.6 |
|
machinery and mechanical appliances |
43 981 |
5.7 |
-0.2 |
+10.5 |
+0.7 |
|
beverages, spirits and vinegar |
31 434 |
4.0 |
-2.9 |
+15.9 |
-23.6 |
|
iron and steel |
30 622 |
3.9 |
-4.4 |
-41.2 |
-7.3 |
|
vehicles other than railway or tramway rolling stock, and parts and accessories thereof |
27 877 |
3.6 |
+1.9 |
-6.6 |
-9.2 |
|
articles of iron and steel |
27 582 |
3.5 |
+8.2 |
-12.5 |
-0.1 |
|
pharmaceutical products |
26 314 |
3.4 |
+19.7 |
-14.2 |
-0.5 |
|
dairy produce, eggs, natural honey |
24 422 |
3.1 |
+14.7 |
+15.6 |
+4.7 |
Rise of exports of pharmaceutical products in June 2014, as compared to June 2013, was mostly affected by the increase in exports of medicaments by 1.1 mln euros or 5.9%. In turn, exports of iron and steel dropped rapidly as exports of waste and scrap of cast iron decreased by 4.1 mln euros or 28.9%.
Changes of main commodities in Latvia’s imports in June 2014, at current prices
|
|
thsd euros |
% of total |
% (+, –) over |
||
|
June 2013 |
May 2014 |
average of previous 12 months |
|||
|
Total |
986 637 |
100 |
+2.1 |
-0.2 |
-5.7 |
|
mineral fuels, mineral oils and products of their distillation |
138 272 |
14.0 |
-5.4 |
+1.6 |
-14.0 |
|
electrical machinery and equipment |
96 773 |
9.8 |
-1.4 |
-4.9 |
-7.0 |
|
machinery and mechanical appliances |
82 995 |
8.4 |
-4.5 |
+5.5 |
-8.5 |
|
vehicles other than railway or tramway rolling stock, and parts and accessories thereof |
64 461 |
6.5 |
-14.7 |
+6.0 |
-6.2 |
|
plastics and articles thereof |
43 588 |
4.4 |
+0.04 |
+4.4 |
+4.8 |
|
pharmaceutical products |
43 418 |
4.4 |
+32.6 |
-19.3 |
+3.1 |
|
iron and steel |
38 033 |
3.9 |
+14.7 |
+9.9 |
+2.0 |
Growth of imports of pharmaceutical products in June 2014, as compared to June 2013, was mostly affected by the increase in imports of medicaments by 2.7 mln euros or 10.9%. In turn, decline in imports of passenger cars by 4.9 mln euros or by 14.6% significantly influenced the total imports of vehicles other than railway or tramway rolling stock, and parts and accessories thereof.
More information on Latvia’s foreign trade by month and quarter, by country group and commodity group is available in the CSB data base section "Foreign trade" Short term statistical data.
1 Data on March 2014 have been revised.


 «The Baltic Course» Is Sold and Stays in Business!
