
Analytics, Baltic Export, Baltic States – CIS, EU – Baltic States, Foreign trade , Lithuania
International Internet Magazine. Baltic States news & analytics
Saturday, 27.04.2024, 01:38
Foreign trade deficit of Lithuania amounted to LTL 0.7 bln
 Print version
Exports of goods of Lithuanian origin amounted to LTL 4 billion. The foreign trade deficit of Lithuania amounted to LTL 0.7 billion.
Over the month (May 2014, against April), exports increased by 0.2, imports – by 1.8%. The increase in exports was influenced by an increase in exports of petroleum products (5.5%) and boilers, machinery and mechanical appliances and parts thereof (14.3%). The increase in imports was influenced by a 26.1% increase in imports of crude oil. Mineral products excluded, exports decreased by 1.2, imports – by 0.9%. Exports of goods of Lithuanian origin decreased by 0.6%, mineral products excluded – by 3.4%.
In May 2014, against May 2013, exports increased by 7.1, imports – by 11.5%. The increase in exports was influenced by an increase in exports of petroleum products (14.3%), electrical machinery and equipment and parts thereof (47.2%) and furniture (23.5%). The increase in imports was influenced by an increase in imports of crude oil (57.9%) and boilers, machinery and mechanical appliances and parts thereof (19.8%). Mineral products excluded, exports and imports increased by 6.1 and 8.4% respectively. Exports of goods of Lithuanian origin increased by 8.6, mineral products excluded – by 6%.
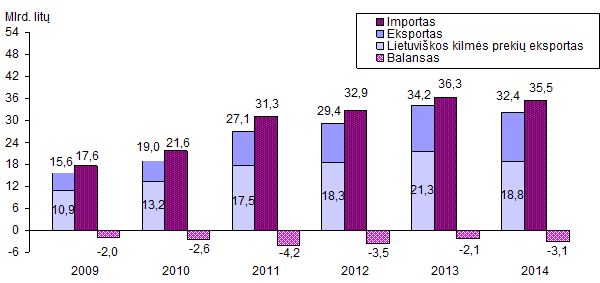 |
| Exports and imports in Lithuania, 2009–2014, January-May |
In January–May 2014, against January–May 2013, exports decreased by 5.3, imports – by 2.3%. The decrease in exports was influenced by a decrease in exports of petroleum products (33.6%), ground vehicles (28.4%) and fertilisers (15.3%). The decrease in imports was influenced by a decrease in imports of crude oil (25.5%) and ground vehicles (18.4%). Mineral products excluded, exports and imports increased by 3.5 and 8.2% respectively. Exports of goods of Lithuanian origin decreased by 11.6, mineral products excluded – grew by 1.6%. Exports to Russia decreased by 2.3%, exports of goods of Lithuanian origin – by 14%, exports of dairy products of Lithuanian origin – by 5.5%. Exports to Ukraine decreased by 10.9%, exports of goods of Lithuanian origin – by 9.6%.
In January–May 2014, the most important Lithuania's partners in exports were Russia (19.9%), Latvia (9.8%), Poland (8%), and Germany (7.9%), in imports – Russia (26.6%), Germany (10.2%), Poland (9.6%), and Latvia (6.5%). Most of the goods of Lithuanian origin were exported to Germany (10.8%), Latvia (8.8%), the Netherlands (7.4%), and the United States (7.1%).
In January–May 2014, the largest share in Lithuania's exports and imports fell within mineral products (17.2 and 26% respectively), machinery and mechanical appliances, electrical equipment (13.2 and 14.7%), and products of the chemical or allied industries (9.7 and 11.3%). As for the goods of Lithuanian origin, the largest share in exports fell within mineral products (25.1%), miscellaneous manufactured articles (10.2%), live animals and animal products (8.3%), and plastics and articles thereof (8.2%).
Table 1. Foreign trade balance, LTL million
|
|
Exports |
Imports |
Balance |
|
January–May 2013 |
34 188.0 |
36 311.6 |
−2 123.6 |
|
January |
6 596.2 |
7 322.7 |
–726.5 |
|
February |
6 756.0 |
6 940.9 |
–184.9 |
|
March |
7 413.8 |
7 367.8 |
46.0 |
|
I quarter |
20 765.9 |
21 631.4 |
–865.5 |
|
April |
6 988.8 |
7 826.5 |
–837.7 |
|
May |
6 433.2 |
6 853.6 |
–420.4 |
|
June |
6 787.3 |
6 723.4 |
63.9 |
|
II quarter |
20 209.3 |
21 403.6 |
–1 194.3 |
|
July |
7 027.2 |
8 105.3 |
–1 078.1 |
|
August |
7 288.3 |
7 630.6 |
–342.3 |
|
September |
7 449.0 |
8 017.7 |
–568.7 |
|
III quarter |
21 764.4 |
23 753.5 |
–1 989.1 |
|
October |
7 832.0 |
8 340.2 |
–508.2 |
|
November |
7 280.3 |
7 892.2 |
–611.9 |
|
December |
6 895.6 |
7 468.9 |
–573.3 |
|
IV quarter |
22 007.9 |
23 701.3 |
–1 693.4 |
|
2013 |
84 747.6 |
90 489.8 |
–5 742.2 |
|
|
|
|
|
|
January–May 2014 |
32 363.3 |
35 469.2 |
−3 105.9 |
|
January |
5 862.7 |
6 480.9 |
−618.2 |
|
February |
6 208.6 |
6 512.3 |
−303.7 |
|
March1 |
6 528.6 |
7 320.3 |
−791.7 |
|
I quarter1 |
18 600.0 |
20 313.5 |
−1 713.5 |
|
April1 |
6 874.6 |
7 511.3 |
−636.7 |
|
May |
6 888.6 |
7 644.3 |
−755.7 |
1 Revised data.
Table 2. Structure of and changes in foreign trade by BEC in January–May 2014
|
BEC |
Exports |
Imports |
||||
|
Value, LTL million |
Share, % |
Change, against the respective period in 2013, % |
Value, LTL million |
Share, % |
Change, against the respective period in 2013, % |
|
|
Total |
32 363.3 |
100.0 |
−5.3 |
35 469.2 |
100.0 |
−2.3 |
|
Capital goods |
3 528.6 |
10.9 |
4.0 |
4 317.1 |
12.2 |
–0.5 |
|
Intermediate goods |
16 451.6 |
50.8 |
−6.8 |
21 167.3 |
59.7 |
−7.3 |
|
Consumption goods |
10 207.5 |
31.5 |
7.3 |
8 881.5 |
25.0 |
11.8 |
|
Motor spirit |
1 542.1 |
4.8 |
−43.0 |
8.2 |
0.0 |
−58.4 |
|
Passenger motor cars |
558.2 |
1.7 |
−31.6 |
1 090.6 |
3.1 |
–6.8 |
|
Other |
75.2 |
0.2 |
−29.7 |
4.7 |
0.0 |
−28.6 |
Table 3. Structure of and changes in trade with key foreign partners in January–May 2014
|
|
Exports |
|
Imports |
|||||
|
Value, LTL million |
Share, % |
Share of goods of Lithuanian origin, % |
Change, against the respective period in 2013, % |
Value, LTL million |
Share, % |
Change, against the respective period in 2013, % |
||
|
Total |
32 363.3 |
100.0 |
58.1 |
−5.3 |
Total |
35 469.2 |
100.0 |
−2.3 |
|
EU28 |
18 645.2 |
57.6 |
70.7 |
−3.0 |
EU28 |
22 523.5 |
63.5 |
6.4 |
|
CIS3 |
9 702.1 |
30.0 |
19.9 |
−4.1 |
CIS3 |
10 189.7 |
28.7 |
−19.4 |
|
EFTA4 |
939.4 |
2.9 |
92.4 |
12.8 |
EFTA4 |
244.5 |
0.7 |
−13.6 |
|
Russia |
6 426.3 |
19.9 |
13.8 |
−2.3 |
Russia |
8 000.1 |
22.6 |
–28.1 |
|
Latvia |
3 171.4 |
9.8 |
52.2 |
0.0 |
Germany |
3 622.4 |
10.2 |
–2.2 |
|
Poland |
2 598.6 |
8.0 |
51.2 |
12.4 |
Poland |
3 392.5 |
9.6 |
–2.2 |
|
Germany |
2 543.6 |
7.9 |
79.9 |
–3.1 |
Latvia |
2 312.7 |
6.5 |
10.6 |
|
Netherlands |
1 509.4 |
4.7 |
92.6 |
−2.8 |
Netherlands |
2 019.4 |
5.7 |
−1.5 |
|
Estonia |
1 495.4 |
4.6 |
51.6 |
−10.2 |
Italy |
1 630.0 |
4.6 |
27.3 |
|
Belarus |
1 461.9 |
4.5 |
17.0 |
−12.0 |
Belgium |
1 291.3 |
3.6 |
6.4 |
|
United Kingdom |
1 394.6 |
4.3 |
89.2 |
−36.9 |
United Kingdom |
1 262.1 |
3.6 |
68.4 |
|
United States |
1 366.3 |
4.2 |
98.1 |
18.8 |
Belarus |
1 146.0 |
3.2 |
20.0 |
|
Sweden |
1 188.4 |
3.7 |
86.0 |
5.3 |
Sweden |
1 138.9 |
3.2 |
7.3 |
|
Denmark |
880.4 |
2.7 |
84.1 |
17.7 |
France |
964.8 |
2.7 |
1.8 |
|
Ukraine |
850.8 |
2.6 |
76.1 |
−10.9 |
Estonia |
964.7 |
2.7 |
−11.5 |
|
Norway |
782.6 |
2.4 |
93.2 |
9.0 |
China |
869.0 |
2.5 |
9.1 |
|
France |
730.2 |
2.3 |
88.3 |
−22.6 |
Finland |
734.7 |
2.1 |
10.8 |
|
Italy |
626.8 |
1.9 |
82.6 |
15.0 |
Spain |
712.7 |
2.0 |
35.3 |
|
Other countries |
5 336.6 |
16.5 |
67.2 |
−14.2 |
Other countries |
5 407.9 |
15.2 |
18.0 |
3 Armenia,
Azerbaijan, Belarus, Kazakhstan, Kyrgyzstan, Moldova, Russia, Tajikistan,
Turkmenistan, Ukraine, Uzbekistan
4 Iceland, Lichtenstein, Norway, Switzerland.
Table 4. Commodity structure of and changes in exports in January–May 2014
|
CN sections |
Value, LTL million |
Share, % |
Share of goods of Lithuanian origin, % |
Change, against the respective period in 2013, % |
|
|
|
Total |
32 363.3 |
100.0 |
58.1 |
–5.3 |
|
27 |
Mineral fuels, mineral oils and products of their distillation; bituminous substances; mineral waxes |
5 498.2 |
17.0 |
84.8 |
–33.3 |
|
84 |
Boilers, machinery and mechanical appliances; parts thereof |
2 392.1 |
7.4 |
16.3 |
2.7 |
|
94 |
Furniture; bedding, mattresses, mattress supports, cushions and similar stuffed furnishings; lamps and lighting fittings, not elsewhere specified or included; illuminated signs, illuminated nameplates and the like; prefabricated buildings |
2 139.6 |
6.6 |
86.3 |
17.1 |
|
39 |
Plastics and articles thereof |
2 020.1 |
6.2 |
75.7 |
1.4 |
|
85 |
Electrical machinery and equipment and parts thereof; sound recorders and reproducers, television image and sound recorders and reproducers, and parts and accessories of such articles |
1 878.4 |
5.8 |
27.9 |
37.0 |
|
87 |
Vehicles other than railway or tramway rolling stock, and parts and accessories thereof |
1 452.2 |
4.5 |
15.6 |
–28.4 |
|
31 |
Fertilisers |
1 292.5 |
4.0 |
82.1 |
–15.3 |
|
44 |
Wood and articles of wood; wood charcoal |
1 244.4 |
3.8 |
82.1 |
13.2 |
|
04 |
Dairy produce; birds' eggs; natural honey; edible products of animal origin, not elsewhere specified or included |
895.5 |
2.8 |
93.8 |
18.9 |
|
|
Other |
13 550.3 |
41.9 |
49.4 |
4.1 |
Table 5. Commodity structure of and changes in exports of goods of Lithuanian origin in January–May 2014
|
CN sections |
Value, LTL million |
Share, % |
Change, against the respective period in 2013, % |
|
|
|
Total |
18 791.5 |
100.0 |
–11.6 |
|
27 |
Mineral fuels, mineral oils and products of their distillation; bituminous substances; mineral waxes |
4 662.3 |
24.8 |
–36.6 |
|
94 |
Furniture; bedding, mattresses, mattress supports, cushions and similar stuffed furnishings; lamps and lighting fittings, not elsewhere specified or included; illuminated signs, illuminated nameplates and the like; prefabricated buildings |
1 845.6 |
9.8 |
19.7 |
|
39 |
Plastics and articles thereof |
1 528.2 |
8.1 |
1.2 |
|
31 |
Fertilisers |
1 060.8 |
5.6 |
–23.2 |
|
44 |
Wood and articles of wood; wood charcoal |
1 021.3 |
5.4 |
11.1 |
|
04 |
Dairy produce; birds' eggs; natural honey; edible products of animal origin, not elsewhere specified or included |
839.9 |
4.5 |
16.7 |
|
10 |
Cereals |
542.1 |
2.9 |
–30.6 |
|
85 |
Electrical machinery and equipment and parts thereof; sound recorders and reproducers, television image and sound recorders and reproducers, and parts and accessories of such articles |
523.7 |
2.8 |
11.9 |
|
84 |
Boilers, machinery and mechanical appliances; parts thereof |
389.3 |
2.1 |
1.1 |
|
|
Other |
6 378.3 |
34.0 |
2.8 |
Table 6. Commodity structure of and changes in imports in January–May 2014
|
CN sections |
Value, LTL million |
Share, % |
Change, against the respective period in 2013, % |
|
|
|
Total |
35 469.2 |
100.0 |
–2.3 |
|
27 |
Mineral fuels, mineral oils and products of their distillation; bituminous substances; mineral waxes |
8 882.4 |
25.0 |
–23.9 |
|
84 |
Boilers, machinery and mechanical appliances; parts thereof |
2 987.2 |
8.4 |
10.4 |
|
87 |
Vehicles other than railway or tramway rolling stock, and parts and accessories thereof |
2 321.3 |
6.5 |
–18.4 |
|
85 |
Electrical machinery and equipment and parts thereof; sound recorders and reproducers, television image and sound recorders and reproducers, and parts and accessories of such articles |
2 212.9 |
6.2 |
26.6 |
|
39 |
Plastics and articles thereof |
1 511.3 |
4.3 |
10.8 |
|
30 |
Pharmaceutical products |
1 074.1 |
3.0 |
11.7 |
|
29 |
Organic chemicals |
887.5 |
2.5 |
–3.1 |
|
08 |
Edible fruit and nuts; peel of citrus fruit or melons |
829.6 |
2.3 |
0.0 |
|
07 |
Edible vegetables and certain roots and tubers |
693.1 |
2.0 |
–1.8 |
|
|
Other |
14 069.8 |
39.8 |
11.9 |
Table 7. Volume of and changes in imports and exports
|
Period |
Exports |
Exports of goods of Lithuanian origin |
Imports |
Balance |
|||
|
value, LTL million |
change, against the previous month, % |
value, LTL million |
change, against the previous month, % |
value, LTL million |
change, against the previous month, % |
LTL million |
|
|
2013-05 |
6 433.2 |
−8.0 |
3 648.9 |
−11.4 |
6 853.6 |
−12.4 |
−420.4 |
|
2013-06 |
6 787.3 |
5.5 |
4 108.8 |
12.6 |
6 723.4 |
−1.9 |
63.9 |
|
2013-07 |
7 027.2 |
3.5 |
4 062.0 |
−1.1 |
8 105.3 |
20.6 |
−1 078.1 |
|
2013-08 |
7 288.3 |
3.7 |
4 306.4 |
6.0 |
7 630.6 |
−5.9 |
−342.3 |
|
2013-09 |
7 449.0 |
2.2 |
4 702.8 |
9.2 |
8 017.7 |
5.1 |
−568.7 |
|
2013-10 |
7 832.0 |
5.1 |
4 645.4 |
−1.2 |
8 340.2 |
4.0 |
−508.2 |
|
2013-11 |
7 280.3 |
−7.0 |
4 155.8 |
−10.5 |
7 892.2 |
−5.4 |
−611.9 |
|
2013-12 |
6 895.6 |
−5.3 |
3 964.6 |
−4.6 |
7 468.9 |
−5.4 |
−573.3 |
|
2014-01 |
5 862.7 |
−15.0 |
3 565.6 |
−10.1 |
6 480.9 |
−13.2 |
−618.2 |
|
2014-02 |
6 208.6 |
5.9 |
3 614.9 |
1.4 |
6 512.3 |
0.5 |
−303.7 |
|
2014-03 |
6 528.6 |
5.2 |
3 664.1 |
1.4 |
7 320.3 |
12.4 |
−791.7 |
|
2014-04 |
6 874.6 |
5.3 |
3 985.3 |
8.8 |
7 511.3 |
2.6 |
−636.7 |
|
2014-05 |
6 888.6 |
0.2 |
3 961.6 |
−0.6 |
7 644.3 |
1.8 |
−755.7 |
Note. Due
to rounding, the sum of lines or columns in some tables may disagree with the
"Total".
For more information, see the Database of Indicators.


 «The Baltic Course» Is Sold and Stays in Business!
