
Analytics, Construction, Good for Business, Latvia, Legislation, Real Estate
International Internet Magazine. Baltic States news & analytics
Tuesday, 23.06.2026, 10:24
Construction output in Latvia in 9 months rose by 17.8%; 333 building permits granted in Q3
 Print version
Compared to the 2nd quarter of 2012, construction output in the 3rd quarter of 2012 reduced by 0.8%, according to seasonally adjusted data at constant prices. Of which construction of buildings grew by 0.1% and construction of civil engineering structures diminished by 0.8%.
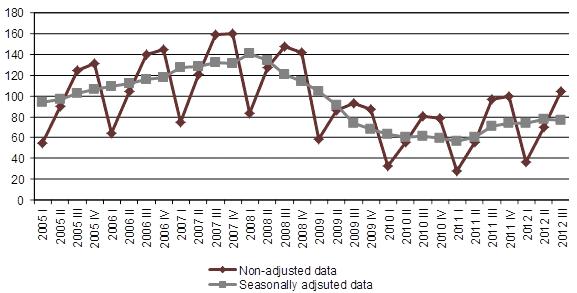 |
| Construction production index (2005 = 100) |
Compared to the 3rd quarter of 2011, construction output in the 3rd quarter of 2012 grew by 8.3%, according to calendar adjusted data at constant prices. Of which construction of buildings increased by 6.2% and construction of civil engineering structures – by 9.6%.
If compared to the corresponding period of the previous year, the most notable growth in construction and repairs was recorded in the construction of office buildings and in the construction of streets and roads – of 60.9% and 21.8%, respectively. Whereas most significant reduction was observed in the construction of bridges and tunnels, as well as construction of main pipelines and cable lines – of 57.1% and 38.1%.
As compared to the nine months of 2011, construction output in the nine months of 2012 rose by 17.8%, according to calendar adjusted data at constant prices. Of which construction of buildings increased by 14.3% and construction of civil engineering structures – by 19.4%.
Construction output and its changes
|
|
Total (at current prices, mln LVL) |
Nine months of 2012 compared to nine months of 2011, % (at constant prices, calendar adjusted) |
3rd quarter 2012 compared to |
||
|
Nine months of 2012 |
3rd quarter of 2012 |
2nd quarter of 2012, % (at constant prices, seasonally adjusted) |
3rd quarter of 2011, % (at constant prices, calendar adjusted) |
||
|
Total |
715.3 |
354.5 |
17.8 |
-0.8 |
8.3 |
|
of which: |
|
|
|
|
|
|
Residential buildings |
49.0 |
23.0 |
10.9 |
-7.8 |
4.4 |
|
Office buildings |
22.8 |
8.6 |
60.7 |
20.8 |
60.9 |
|
Industrial buildings and warehouses |
46.0 |
18.6 |
-8.7 |
-10.3 |
-27.5 |
|
School, university and research buildings |
36.5 |
20.8 |
7.1 |
-0.4 |
5.3 |
|
Hospital or institutional care buildings |
23.1 |
10.0 |
6.6 |
4.7 |
-8.5 |
|
Highways, streets, roads, airfield runways, railways |
192.3 |
116.2 |
38.4 |
-10.9 |
21.8 |
|
Bridges and tunnels |
19.2 |
5.8 |
-48.1 |
-32.5 |
-57.1 |
|
Harbours and dams |
23.0 |
11.0 |
35.4 |
-12.2 |
-4.8 |
|
Mainpipelines, communication and electricity lines |
34.5 |
19.8 |
21.8 |
-11.3 |
-3.8 |
|
Local pipelines and cables |
55.3 |
23.8 |
-22.3 |
6.6 |
-38.1 |
In the 3rd quarter of 2012, 333 building permits were granted for the construction of new single – dwelling houses with total floor space 76.4 thousand m2 (in 3rd quarter of 2011 – 382 permits and 82.9 thousand m2, respectively), whereas for the construction of new industrial buildings and warehouses with total floor space 54.5 thousand m2 58 permits were issued (in the 3rd quarter of 2011 – 94.6 thousand m2 and 51 permit).
More information on construction output indices and building permits granted for the construction of buildings is available in the CSB database: Construction.


 «The Baltic Course» Is Sold and Stays in Business!
