
Analytics, Baltic Export, Foreign trade , Latvia
International Internet Magazine. Baltic States news & analytics
Friday, 26.04.2024, 13:13
Export value in June decreased by 2.5%, while import value grew by 0.7% in Latvia
 Print version
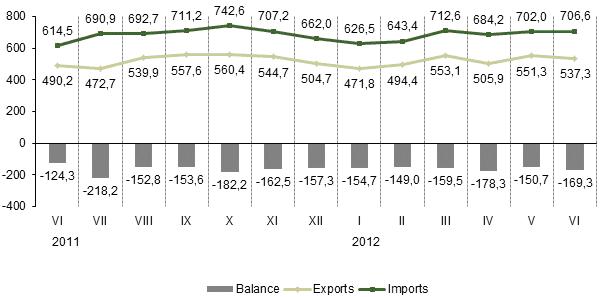
As compared to the previous month, export value in June 2012 decreased by 2.5%, while import value grew by 0.7%. The most significant drop was recorded in export of mineral products – of LVL 22.7 million or 37.5% and in export of base metals and articles of base metals – of LVL 9.8 million or 10.4%. In its turn, import growth was mostly affected by increase in import of transport vehicles – of LVL 7.3 million or 12.5%, in import of mineral products – of 6.4 million or 5.5% and in import of products of the chemical and allied industries – of LVL 6.1 million or 10.5%.
In January – June 2012, foreign trade turnover value reached LVL 7189.0 million – 13.5% or LVL 857.8 million more than in the corresponding period of the previous year. Of which exports comprised LVL 3113.8 million – an increase of 10.5% or LVL 295.3 million, whereas imports constituted LVL 4075.2 million – 16.0% or LVL 562.5 million more than a year ago.
 |
| Foreign trade of Latvia, million LVL (1) |
________________
1) Data
on March 2012 have been revised.
Main commodities in Latvia’s foreign trade in June 2012, at current prices
|
|
Exports |
Imports |
Foreign trade balance, thousand LVL (+,-) |
|||||
|
thousand LVL |
% of total |
% (+, –) over 2011 June |
thousand LVL |
% of total |
% (+, –) over 2011 June |
|||
|
Total |
537 277 |
100 |
+9.6 |
706 566 |
100 |
+15.0 |
-169 289 |
|
|
Agricultural and food products (I-IV) |
91 156 |
17.0 |
+31.2 |
107 605 |
15.2 |
+14.9 |
-16 449 |
|
|
Live animals and animal products (I) |
25 497 |
4.7 |
+18.2 |
24 666 |
3.5 |
+13.3 |
+831 |
|
|
|
meat and offal (02) |
3 223 |
0.6 |
+19.9 |
8 568 |
1.2 |
+2.9 |
-5 345 |
|
|
fish (fresh, frozen, smoked) (03) |
7 081 |
1.3 |
+48.2 |
7 315 |
1.0 |
+20.2 |
-234 |
|
|
dairy produce, eggs (04) |
12 916 |
2.4 |
+7.0 |
7 151 |
1.0 |
+9.9 |
+5 765 |
|
Vegetation products (II) |
16 268 |
3.0 |
+43.1 |
25 429 |
3.6 |
+9.5 |
-9 161 |
|
|
|
edible fruit and nuts (08) |
3 485 |
0.6 |
+63.4 |
8 318 |
1.2 |
+14.4 |
-4 833 |
|
|
cereals (10) |
5 381 |
1.0 |
+15.5 |
3 398 |
0.5 |
-18.9 |
+1 983 |
|
|
oilseeds (12) |
2 023 |
0.4 |
+4.4 times |
1 587 |
0.2 |
-29.2 |
+436 |
|
Prepared foodstuffs (IV) |
48 005 |
8.9 |
+36.7 |
49 836 |
7.1 |
+12.8 |
-1 831 |
|
|
|
preparations of meat, or fish (16) |
5 598 |
1.0 |
+9.3 |
2 796 |
0.4 |
+6.4 |
+2 802 |
|
|
miscellaneous edible preparations (incl. coffee, tea, etc.)(21) |
1 745 |
0.3 |
+1.1 |
7 306 |
1.0 |
+22.1 |
-5 561 |
|
|
beverages, spirits and vinegar (22) |
28 004 |
5.2 |
+58.1 |
13 099 |
1.9 |
+1.9 |
+14 905 |
|
|
tobacco and manufactured tobacco substitutes (24) |
1 510 |
0.3 |
-13.5 |
3 651 |
0.5 |
+28.2 |
-2 141 |
|
Mineral products (V) 1) |
37 754 |
7.0 |
-28.5 |
122 288 |
17.3 |
+11.4 |
-84 534 |
|
|
|
mineral fuels, mineral oils and products of their distillation (27) |
33 326 |
6.2 |
-30.9 |
119 056 |
16.8 |
+11.1 |
-85 730 |
|
Products of the chemical and allied industries (VI) |
38 718 |
7.2 |
-8.6 |
63 975 |
9.1 |
+12.3 |
-25 257 |
|
|
|
pharmaceutical products (30) |
17 769 |
3.3 |
-13.3 |
23 783 |
3.4 |
-5.7 |
-6 014 |
|
Plastics and articles thereof; rubber and articles thereof (VII) |
18 047 |
3.4 |
+16.2 |
39 610 |
5.6 |
+8.5 |
-21 563 |
|
|
|
plastics and articles thereof (39) |
14 233 |
2.6 |
+15.3 |
30 407 |
4.3 |
+10.6 |
-16 174 |
|
Wood and articles of wood; wood charcoal; cork and articles of cork; manufactures of straw, of esparto or of other plaiting materials (IX) |
93 265 |
17.4 |
+8.3 |
10 841 |
1.5 |
+15.8 |
+82 424 |
|
|
|
wood and articles of wood; wood charcoal (44) |
93 221 |
17.4 |
+8.4 |
10 761 |
1.5 |
+15.7 |
+82 460 |
|
Pulp of wood or of other fibrous cellulosic material; paper and paperboard and articles thereof (X) |
11 987 |
2.2 |
+22.0 |
15 693 |
2.2 |
+2.7 |
-3 706 |
|
|
|
paper and paperboard; articles of paper pulp, of paper or of paperboard (48) |
6 418 |
1.2 |
+14.2 |
14 046 |
2.0 |
+1.6 |
-7 628 |
|
|
products of the printing industry; manuscripts (49) |
4 742 |
0.9 |
+31.6 |
1 561 |
0.2 |
+15.7 |
+3 181 |
|
Textiles and textile articles (XI) |
22 791 |
4.2 |
+23.1 |
27 781 |
3.9 |
+20.8 |
-4 990 |
|
|
|
knitted or crocheted fabrics (60) |
1 774 |
0.3 |
+50.4 |
1 874 |
0.3 |
+17.6 |
-100 |
|
|
articles of apparel and clothing accessories, knitted or crocheted (61) |
6 069 |
1.1 |
+13.2 |
5 308 |
0.8 |
+12.3 |
+761 |
|
|
articles of apparel and clothing accessories, not knitted or crocheted (62) |
8 158 |
1.5 |
+37.2 |
7 929 |
1.1 |
+43.7 |
+229 |
|
Base metals and articles of base metals (XV) |
83 979 |
15.6 |
+22.8 |
82 149 |
11.6 |
+18.4 |
+1 830 |
|
|
|
iron and steel (72) |
47 316 |
8.8 |
+36.2 |
45 957 |
6.5 |
+17.2 |
+1 359 |
|
|
articles of iron or steel (73) |
24 285 |
4.5 |
+39.9 |
22 185 |
3.1 |
+18.4 |
+2 100 |
|
Machinery and mechanical appliances; electrical equipment (XVI) |
71 770 |
13.4 |
+21.3 |
122 580 |
17.3 |
+22.8 |
-50 810 |
|
|
|
machinery and mechanical appliances (84) |
28 769 |
5.4 |
+2.3 |
67 710 |
9.6 |
+25.5 |
-38 941 |
|
|
electrical machinery and equipment (85) |
43 001 |
8.0 |
+38.5 |
54 871 |
7.8 |
+19.6 |
-11 870 |
|
Vehicles, aircraft, vessels and associated transport equipment (XVII) |
28 084 |
5.2 |
-17.8 |
65 370 |
9.3 |
+10.2 |
-37 286 |
|
|
|
vehicles other than railway or tramway rolling stock, and parts and accessories thereof (87) |
26 725 |
5.0 |
-12.8 |
50 484 |
7.1 |
-1.5 |
-23 759 |
|
Miscellaneous manufactured articles (XX) |
14 479 |
2.7 |
+18.0 |
17 604 |
2.5 |
+32.7 |
-3 125 |
|
|
|
furniture; bedding, mattresses, mattress supports, cushions and similar stuffed furnishings; lamps and lighting fittings (94) |
11 968 |
2.2 |
+22.5 |
10 515 |
1.5 |
+34.0 |
+1 453 |
|
Other goods |
25 247 |
4.7 |
+16.3 |
31 070 |
4.4 |
+10.3 |
-5 823 |
|
______________
¹) This group includes useful minerals, oil and oil products, natural gas and electricity.
In June 2012 the most significant share (69.7%) in Latvia’s export had export to the countries of the European Union, followed by export to the CIS countries – 15.6%. The main export partners were Lithuania (16.8% of the total export volume), Estonia (12.6%), Russia (11.4%), Germany (7.2%) and Sweden (5.6%).
In June 2012 the most significant share (78.2%) in Latvia’s import had import from the countries of the European Union, followed by import from the CIS countries – 15.3%. The main import partners were Lithuania (19.5% of the total import volume), Germany (11.2%), Poland (8.8%), Russia (7.7%) and Estonia (7.5%).
More information on Latvia’s foreign trade by month and quarter, by country group and commodity group is available in the CSB data base section Foreign trade Short term statistical data.


 «The Baltic Course» Is Sold and Stays in Business!
