
Analytics, Baltic Export, Estonia, Foreign trade
International Internet Magazine. Baltic States news & analytics
Tuesday, 09.06.2026, 13:09
Exports of goods from Estonia decreased by 8% in May
 Print version
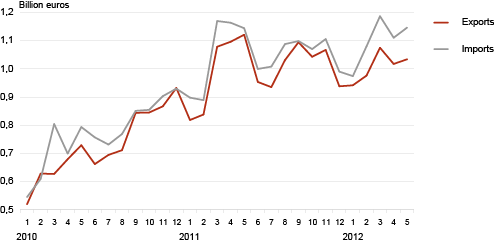
In May 2012, exports from Estonia amounted to 1 billion euros and imports to Estonia to 1.1 billion euros at current prices. The trade deficit was 113 million euros, which was nearly five times bigger compared to May 2011.
Compared to the previous month, exports continued on the positive trend – from the beginning of the year, exports have increased every month compared to the previous month (except April). In May the turnover of exports increased by 2%, of imports – 3%. A slight increase of exports turnover was mainly influenced by the increase in the dispatches of machinery and equipment and miscellaneous products (incl. furniture). The increase in the turnover of imports was mainly influenced by the increase in the arrivals of machinery and equipment and mineral fuels.
In Estonia’s exports in May, the biggest share was held by machinery and equipment (30% of Estonia’s total exports), followed by mineral fuels (incl. motor spirits, shale oils and electricity – 12%) and metals and products thereof (10%). The decrease in exports compared to May 2011 was mainly influenced by the decrease in the dispatches of mineral fuels by a half (down by 52%). A slight increase was mentioned in the dispatches of machinery and equipment (the growth rate 11%).
In May the biggest share of Estonia’s imports was held by machinery and equipment (28% of Estonia’s total imports), followed by mineral fuels (15%) and agricultural products and food preparations (10%). There was a significant decrease in the arrivals of mineral fuels (down by 17%) compared to May of the previous year. At the same time, the arrivals of machinery and equipment and raw materials and products of chemical industry increased slightly (by 5% and 13%, respectively).
The biggest share of commodities was exported to Finland and Sweden (to both countries, 16% of Estonia’s total exports) and Russia (12%). Compared to May 2011, the decrease in total exports was mostly influenced by the decrease in the dispatches to the USA and Germany (down by 74% and 11%, respectively). At the same time, the turnover of exports to Russia increased by 27%. Electrical equipment, wood and products of wood and furniture were the main commodities exported to Finland and Sweden, mechanical and electrical equipment and dyeing products to Russia.
The main countries of consignment were Finland (14% of Estonia’s total imports), Russia and Germany (11% both). Arrivals of goods from Poland and Lithuania decreased (down by 27% and 19%, respectively). But arrivals of goods from Russia and Finland increased (30% and 16%, respectively). Electrical equipment and fuels were the main commodities imported from Finland, fuels and wood and wood products from Russia, and transport equipment and electrical equipment from Germany.
According to the Estonian Institute of Economic Research, the economic sentiment indicator, which reflects Estonia’s entrepreneurs’ and consumers’ confidence, has also shown a positive trend in the first months of the year. But in May the indicator deteriorated. The same indicator improved in June in Estonia, but in Sweden and Finland it deteriorated.
Estonian trade by months, 2010–2012
| Country of destination, group of countries |
Exports, million euros |
Share, % |
Change compared to same month of previous year, % |
Country of consignment, group of countries |
Imports, million euros |
Share, % |
Change compared to same month of previous year, % |
|---|---|---|---|---|---|---|---|
| Total | 1 034.5 | 100 | -8 | Total | 1 147.2 | 100 | 0 |
| EU27 | 701.8 | 68 | 2 | EU27 | 872.4 | 76 | 0 |
| EA17 | 300.5 | 29 | -8 | EA17 | 426.6 | 37 | 9 |
| CIS | 149.7 | 14 | 25 | CIS | 160.7 | 14 | 22 |
| 1. Finland | 164.1 | 16 | 0 | 1. Finland | 158.2 | 14 | 16 |
| 2. Sweden | 164.0 | 16 | 7 | 2. Russia | 123.4 | 11 | 30 |
| 3. Russia | 119.8 | 12 | 27 | 3. Germany | 122.7 | 11 | -1 |
| 4. Latvia | 83.1 | 8 | 15 | 4. Latvia | 107.3 | 9 | -11 |
| 5. Lithuania | 65.1 | 6 | 39 | 5. Sweden | 106.1 | 9 | 10 |
| 6. Germany | 44.7 | 4 | -11 | 6. Lithuania | 74.4 | 6 | -19 |
| 7. Norway | 42.2 | 4 | 20 | 7. Poland | 55.5 | 5 | -27 |
| 8. United Kingdom | 31.8 | 3 | 27 | 8. United Kingdom | 45.3 | 4 | 1 |
| 9. USA | 28.6 | 3 | -74 | 9. Netherlands | 42.3 | 4 | 17 |
| 10. Netherlands | 26.0 | 3 | 56 | 10. China | 42.0 | 4 | -12 |
| Commodity section by Combined Nomenclature (CN) |
Exports | Imports | Balance, million euros | ||||
|---|---|---|---|---|---|---|---|
| million euros |
share, % |
change compared to same month of previous year, % |
million euros |
share, % |
change compared to same month of previous year, % | ||
| TOTAL | 1 034.5 | 100 | -8 | 1 147.2 | 100 | 0 | -112.7 |
| Agricultural products and food preparations (I–IV) | 82.5 | 8 | -2 | 114.4 | 10 | -1 | -31.9 |
| Mineral products (V) | 128.2 | 12 | -52 | 174.3 | 15 | -17 | -46.1 |
| Raw materials and products of chemical industry (VI) | 47.4 | 5 | 0 | 89.2 | 8 | 13 | -41.8 |
| Articles of plastics and rubber (VII) | 36.0 | 4 | 16 | 59.8 | 5 | 8 | -23.8 |
| Wood and products thereof (IX) | 86.5 | 8 | -6 | 34.6 | 3 | 15 | 51.9 |
| Paper and articles thereof (X) | 24.7 | 2 | -11 | 20.4 | 2 | 3 | 4.3 |
| Textiles and products thereof (XI) | 26.4 | 3 | -1 | 46.3 | 4 | 3 | -19.9 |
| Metals and products thereof (XV) | 101.6 | 10 | 18 | 97.4 | 8 | -8 | 4.2 |
| Machinery and equipment (XVI) | 305.3 | 30 | 11 | 317.9 | 28 | 5 | -12.6 |
| Transport equipment (XVII) | 62.4 | 6 | -1 | 114.2 | 10 | 3 | -51.8 |
| Miscellaneous manufactured articles (XX) | 77.5 | 7 | 11 | 23.8 | 2 | 12 | 53.7 |
| Other | 56.0 | 5 | 10 | 54.9 | 5 | 11 | 1.1 |


 «The Baltic Course» Is Sold and Stays in Business!
