
Analytics, Covid-19, Inflation, Latvia, Markets and Companies
International Internet Magazine. Baltic States news & analytics
Friday, 10.07.2026, 09:14
Annual deflation in Latvia made 0.7% in November
 Print version
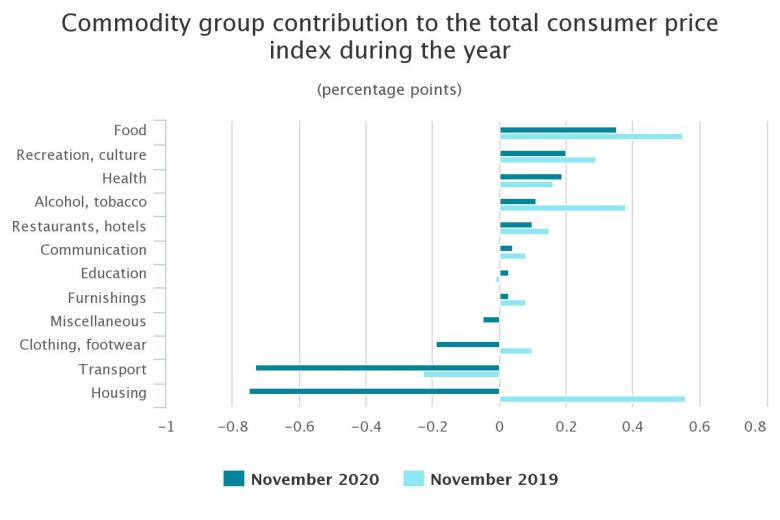
Compared to November 2019, in November 2020 the average level of consumer prices was mainly influenced by the drop in prices of goods and services related to housing, goods and services related to transport, clothing and footwear, as well as the rise in prices of food and non-alcoholic beverages, goods and services related to recreation and culture, health care, alcoholic beverages and tobacco products, restaurant and hotel services.
The average level of prices of alcoholic beverages and tobacco products increased by 1.3 % over the year. Prices of tobacco products rose by 2.9 %. Prices of alcoholic beverages increased on average by 0.4 %, mainly due to higher prices of spirits (2.7 %). Prices decreased for beer (2.5 %) and wine (1.4 %).
The average price level of clothing and footwear decreased by 3.1%. Prices of garments fell on average by 2.3 %, but footwear prices - by 6.1 %.
Prices of goods and services related to housing dropped by 4.6 %. The fall in prices was mainly due to cheaper heat energy, natural gas, electricity, rentals for housing and solid fuels.
Maintenance charges in multi-occupied buildings, as well as services for the maintenance and repairs of the dwelling, became more expensive.
In the health care group, the average level of prices increased by 3.2 % over the year. The rise in price level was mainly influenced by the increase in prices of dental services, prices in general medical practice, as well as prices in medical specialist practice. In turn, the fall was registered in prices of pharmaceutical products.
Prices of goods and services related to transport declined by 5.3 %, which was affected by the drop in price of fuel by 13.9 %. The prices of diesel decreased on average by 17.1 %, petrol – by 10.8 % while the prices of auto gas by – 5.0 %. Passenger transport by air became cheaper. Over the year, the prices for passenger transport by road, passenger transport by sea, as well as the prices of maintenance and repair of personal transport equipment increased.
Prices of cultural and recreational goods and services increased by 2.5 %. Over the year, the average level for cultural service prices, personal computers and pet food increased. Prices of package holidays fell.
The average level of restaurant and hotel service prices increased by 1.8 %. This price rise was mainly affected by catering services, as the average level of canteen service prices increased by 5.1 % and that of restaurant and café services by 2.1 % over the year. In turn, prices of hotel services decreased (10.6 %).
Among other commodity groups, the most notable decline in prices was for motor vehicle insurance, while prices for telecommunication services increased.
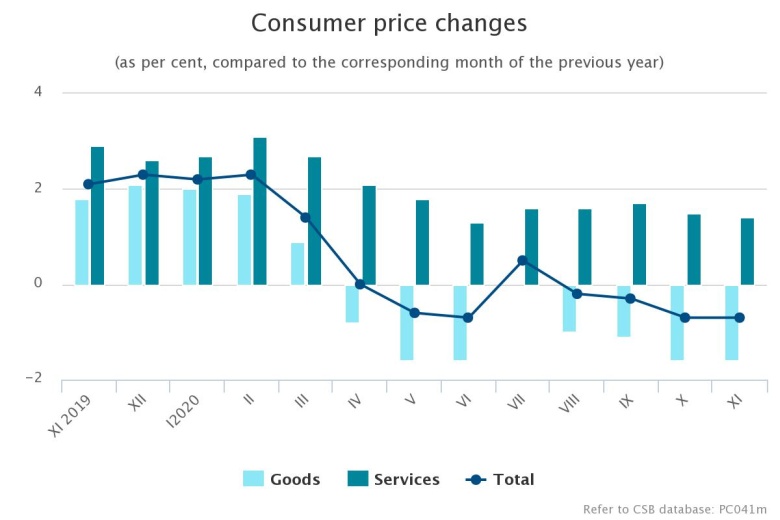
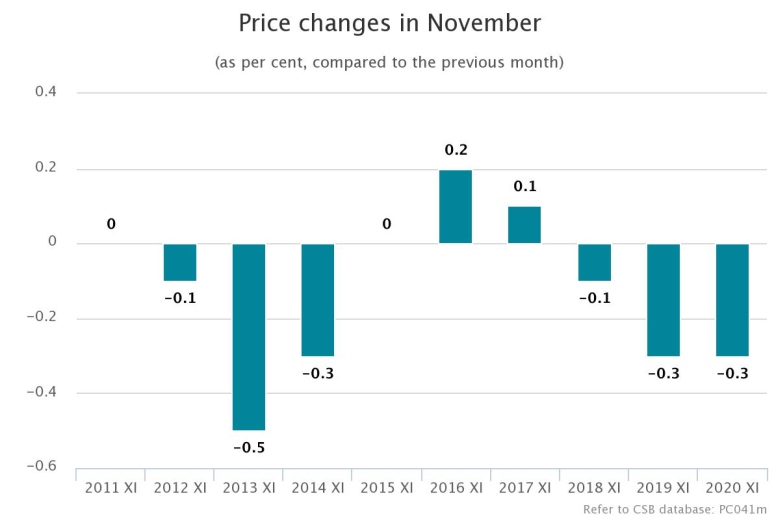
The average level of consumer prices decreased by 0.3 % during the month
In November 2020, compared to October 2020, the average level of consumer prices decreased by 0.3 %. The average price level for goods decreased by 0.1 %, while for services – by 0.6 %.
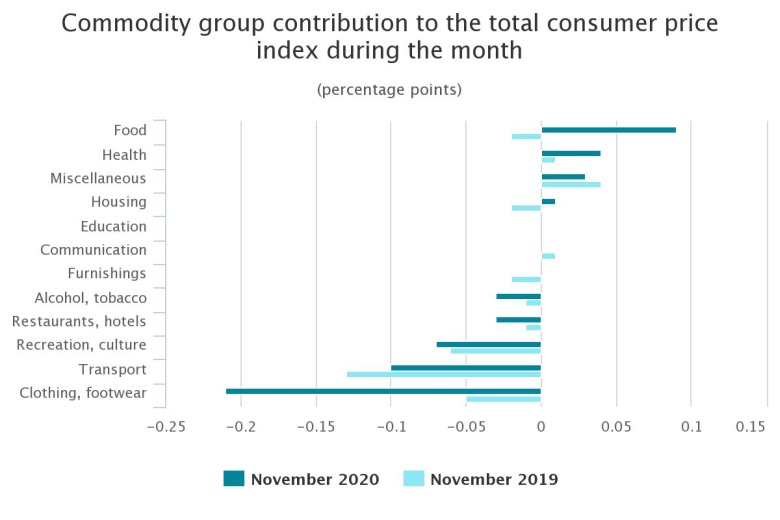
The greatest pressure on the price changes was put by the drop in prices of clothing and footwear, goods and services related to transport, goods and services related to recreation and culture, restaurant and hotel services, alcoholic beverages and tobacco products, as well as the rise in prices in the group of miscellaneous goods and services, food and non-alcoholic beverages, health care.
During the month, prices for food and non-alcoholic beverages increased on average by 0.4 %. The most significant pressure on the average price level increase in the group was put by the rise in prices of fresh vegetables (8.1 %), mainly of tomatoes and cucumbers. Prices also increased for bread (1.3 %), poultry (1.5 %), fresh or chilled fish (6.8 %). Decrease in turn was registered for prices of fresh fruit (3.6 %), ice cream (3.5 %) and rice (6.0 %).
The average price level for alcoholic beverages and tobacco products decreased by 0.4 %, which was mainly affected by the fall in prices of beer due to the sales. The average price level of tobacco products remained unchanged.
Prices of footwear and clothing decreased on average by 3.6 %. Due to the sales, prices of footwear dropped by 8.8 %, while the prices of garments - by 2.0 %.
In the health care group, the average price level increased by 0.7 %, which was mainly influenced by the rise in prices for medical specialist practice and pharmaceutical products.
Prices of goods and services related to transport dropped by 0.7 %. Prices of fuels decreased by 0.9 %, mainly of diesel - by 1.5 %. Prices of petrol decreased by 0.6 %, while prices of auto gas increased by 1.3 %. Prices for passenger transport by air also fell.
Prices of goods and services related to recreation and culture decreased on average by 0.8 %. Prices of flowers dropped, while prices for personal computers and pet food increased.
The prices of restaurant and hotel services decreased by 0.6 %, which was mainly influenced by cheaper restaurant and café services (0.6 %).
In miscellaneous commodity group, prices increased on average by 0.6 % due to the end of sales for articles for personal hygiene and beauty products. The average price level for motor vehicle insurance decreased.
In other commodity groups, the most significant decline was in prices of rentals for housing, household cleaning and maintenance products, while prices for solid fuels increased.
Price changes by commodity groups (as %)
Groups | Price changes in November 2020, compared to: | ||
November 2019 | December 2019 | October 2020 | |
Total | -0.7 | -0.5 | -0.3 |
Food | 1.6 | 1.1 | 0.4 |
Alcohol, tobacco | 1.3 | 2.0 | -0.4 |
Clothing, footwear | -3.1 | 0.8 | -3.6 |
Housing | -4.6 | -4.3 | 0.1 |
Furnishings | 0.8 | 2.2 | -0.1 |
Health | 3.2 | 3.4 | 0.7 |
Transport | -5.3 | -6.7 | -0.7 |
Communication | 1.0 | 1.5 | -0.1 |
Recreation, culture | 2.3 | 2.9 | -0.8 |
Education | 2.1 | 2.1 | 0.0 |
Restaurants, hotels | 1.8 | 1.8 | -0.6 |
Miscellaneous | -1.0 | 0.4 | 0.6 |
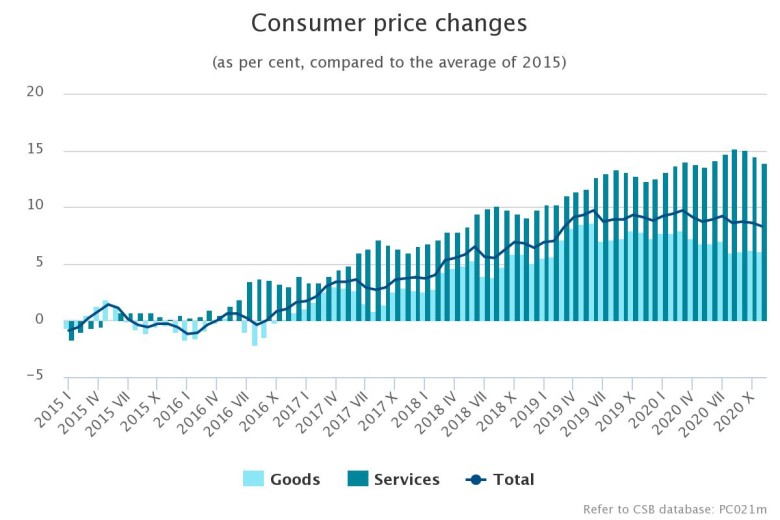
Compared to 2015, consumer prices in November 2020 were 8.3 % higher. Prices of goods rose by 6.1 %, while prices of services – by 13.9 %.
Information on consumer price changes in December 2020 will be published on 12 January 2021.
* Annual inflation reflects consumer price changes, comparing the average price level in the comparison month with the average price level in the corresponding month of the previous year.
COVID-19 influence on consumer price index in November
In November, the total share of Covid-19-related imputations was 2.1 %, which is 3.6 % of total household consumption expenditure.
Due to the declaration of an emergency situation and the related restrictions, Covid-19 had a significant impact on three subclasses of ECOICOP (European Classification of Individual Consumption according to Purpose) - Cinemas, theatres, concerts (imputation rate 88 %); Package holidays (imputation rate 63 %); Personal grooming treatments (imputation rate 87 %).
Imputations were calculated by the methods mentioned below in accordance with recommendations of Eurostat for compilation of indices under the impact of Covid-19.
- Imputation with the annual rate of change of all “reliable” price indices
(In November 2020 annual consumer price index of all "reliable” indices constituted 99.3); - Imputation based on available prices for a particular good or service;
- The last observed price was used (carry forward).
Indices with significant number of imputations (> 50 %) caused by Covid-19 and thus having lower quality in the CSB database are indicated with "u."
More detailed information on imputation methods used in Covid-19 circumstances, as well as action regarding compilation of indices in postcrisis circumstances is available at:
In November, the Covid-19 emergency situation resulted in additional restrictions on both catering and education services. However, the share of imputations in these consumption groups was small, as most catering providers offered dishes from the usual assortment to take away in November, while studies and various courses were held remotely.
- 28.01.2022 BONO aims at a billion!
- 25.01.2021 Как банкиры 90-х делили «золотую милю» в Юрмале
- 30.12.2020 Накануне 25-летия Балтийский курс/The Baltic Course уходит с рынка деловых СМИ
- 30.12.2020 On the verge of its 25th anniversary, The Baltic Course leaves business media market
- 30.12.2020 Business Education Plus предлагает анонсы бизнес-обучений в январе-феврале 2021 года
- 30.12.2020 Hotels showing strong interest in providing self-isolation service
- 30.12.2020 EU to buy additional 100 mln doses of coronavirus vaccine
- 30.12.2020 ЕС закупит 100 млн. дополнительных доз вакцины Biontech и Pfizer
- 29.12.2020 В Rietumu и в этот раз создали особые праздничные открытки и календари 2021
- 29.12.2020 Latvia to impose curfew, state of emergency to be extended until February 7


 «The Baltic Course» Is Sold and Stays in Business!
