
Analytics, Covid-19, Economics, Financial Services, GDP, Latvia, Markets and Companies
International Internet Magazine. Baltic States news & analytics
Sunday, 21.12.2025, 12:27
In Q3, GDP in Latvia has dropped by 2.6%
 Print version
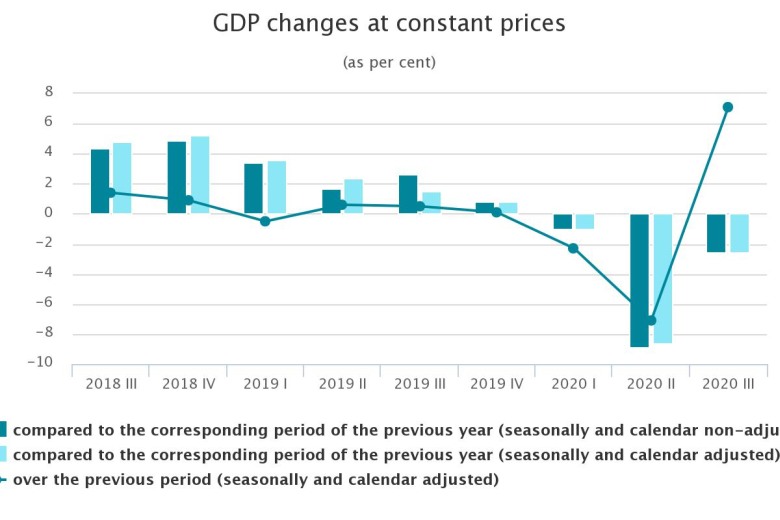
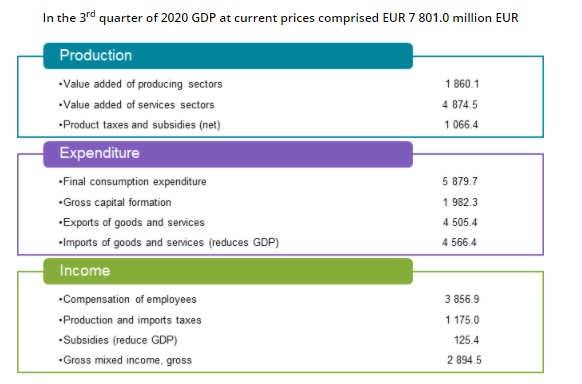
In the 3rd quarter GDP at constant prices was EUR 7.8 billion. As compared to the previous quarter, according to seasonally and calendar adjusted data, GDP increased by 7.1 %.
In the 3rd quarter of 2020, compared to the corresponding period of the previous year, one of the most successful sectors was agriculture, forestry and fishery – increase of 6.3 %. In agriculture production growth comprised 5.5 % – due to favourable climatic conditions increase in crop production 7.9 %, but in livestock production – drop of 0.9 %. In forestry, in turn, increase of 5.9 %, but in fishery – of 2.1 %.
Value added of manufacturing increased by 0.1 % – growth was observed in 11 out of 22 manufacturing sectors. Significant rise was observed in manufacture of computer, electronic and optical products (of 16.1 %) and manufacture of wood and of products of wood (8.2 %). Manufacture of food products rose by 0.2 %. In turn drop in manufacturing was observed in manufacture of non-metallic mineral products – by 4.0 %, manufacture of fabricated metal products – by 4.8 %.
Drop in other industry sectors of 5.8 % was determined by fall in production and distribution of electricity (of 14.7 %) and significant reduction in natural gas supply, which could not be compensated by growth of 11.8 % in mining and quarrying.
Even though increase was observed in two out of three sectors, fall of 0.3 % in construction production was negatively affected by implementation of postponed small projects, which caused drop in demand for several enterprises. Construction of buildings increased by 1.9 % (both projects of residential buildings and public objects were implemented), but specialized construction activities – by 7.8 % (electrical, plumbing and other construction installation activities – by 5.5 %, other specialised construction activities n.e.c. – by 20.5 %, building completion and finishing – by 9.2 %). Decrease in construction of roads and railways (of 3.5 %) and construction of utility projects (13.4 %) affected value added drop in civil engineering of 8.1 %.
Uncertainty regarding the impact of COVID-19 crisis left on economics, makes households and entrepreneurs to be cautious when undertaking new financial liabilities – volume of wholesale, retail trade and repair of motor vehicles and motorcycles has dropped by 7.5 %. Compared to the 3rd quarter of the previous year, retail trade increased by 4.3 %, of which retail sale of food products increased by 3.8 %, but retail sale of non-food products – by 4.6 % (of which retail sale of automotive fuel at petrol filling stations – by 10.3 %). Compared to the corresponding period of the previous year, in wholesale (increase of 1.7 %) most rapid growth was observed in wholesale of information and communication equipment (of 37.8 %) and wholesale of household goods (10.4 %).
Decline of value added of 14.7 % in transport and storage sectors was affected by the drop in provision of services in passenger traffic by 57.6 %, in storage and transport auxiliary services – by 4.7 %, in postal and courier activities – by 1.1 % and in freight transport – by 0.8 %.
Even though restrictions imposed during the report period for reduction of COVID-19 pandemic were mitigated, they still continued to affect volume of services provided by accommodation and catering sectors significantly – fall of 28.6 %, of which in accommodation – of 44.5 %, in catering – of 22.6 %.
Value added of information and communication services reduced by 4.7 %. The drop affected all sub-sectors, of which computer programming and consulting fell by 0.9 %, telecommunication services – by 4.6 %, but information services – by 12.5 %.
Fall of 13.3 % in financial and insurance activities was promoted by reduction in financial service activities (of 25.7 %). On the other hand, insurance, reinsurance and pension funding and activities auxiliary to financial services and insurance activities experienced rise of 34.7 % and 11.4 %, respectively. Recession in financial service activities was affected by drop in commission income of credit institutions (from services for card payments, from settlements and payments and account fees) and formation of losses on transactions with financial instruments (in contrast to profit in the corresponding period of the previous year). Growth in insurance, reinsurance and pension funding was promoted by results of activity of life insurance and private pension plans.
Decline of 2.6 % in professional, scientific and technical activities sectors was affected by 9.7 % less services provided in activities of head offices, management consultancy activities, by 10.6 % – in architectural and engineering services, technical testing and analysis. But activity in advertising and market research was successful – increase of 11.7 %.
Administrative and support service activities reduced by 7.1%. It was affected by significant drop of 62.4 % in travel agency, tour operator reservation service and related activities, as well as of 9.8 % – in labour recruitment and provision of personnel and 12.9 % – in security and investigation activities. In some areas volume of services provided increased – in rental and leasing services sector there was a rise of 3.6 %, but in building maintenance and landscape architectural services sectors – 2.8 %.
Due to restrictions imposed, one of services sectors that was hit the hardest by COVID-19 pandemic was arts, entertainment and recreation, where drop against the corresponding period of the previous year reached 22.4 % (the largest reduction in gambling and betting activities – of 29.1 %).
In the 3rd quarter the volume of taxes on products (value added tax, excise and customs taxes) rose by 0.8 %, which was promoted by growth in largest groups of taxes on products – both in value added tax and excise duty revenues.
As compared to GDP flash estimate, total value added of sectors increased by 0.3 percentage points. The latest information on taxes on products concerning the period affected the overall estimate positively and increased GDP by 0.2 percentage points.
In the 3rd quarter of 2020 household expenses for final consumption, compared to the corresponding period of the previous year, reduced by 7.4 %. Even though measures taken by the government to limit spread of Covid-19 infection were gradually lifted and mitigated, their impact was still observed in two out of traditionally largest household expenditure groups: transport (pubic transport, purchase and exploitation of transport vehicles) and recreational and cultural events. Expenditure on transport reduced by 10.7 %, but half less than in the 3rd quarter of the previous year was spent on recreational and cultural events. Affected by the pandemic, households also spent 31.2 % less on accommodation and catering services. Due to limitations imposed by the government on provision of catering services, part of households prepared meals at home, which contributed to increase of household expenditure on purchase of food products by 3.4 %. Household expenses on dwelling remained at the level close to the previous year.
Government final consumption expenditure grew by 2.5 %.
Investment in gross fixed capital fell by 0.8 %. Investment in dwellings and other buildings and structures reduced by 0.8 %, which was affected by drop in demand for small construction projects. Investment in machinery and equipment (of which in transport vehicles) reduced by 2.6 %, but investment in intellectual property products – grew by 4.9 %.
Exports of goods and services reduced by 3.7 %, of which exports of goods (76 % of total exports) rose by 6.8 %. Successful results in exports of goods were mainly determined by growth of exports of vegetable products and machinery and mechanical appliances, electrical equipment. Drop in transport and tourism services affected by the pandemic was the key driver for reduction in exports of services of 26.9 %.
Imports of goods and services decreased by 2.6 %. Imports of goods, which comprises 86 % of total imports, has risen by 1.7 %, while imports of services – decreased by 23.1 %. Decline in imports of services was mainly determined by drop in imports of transport and tourism services.
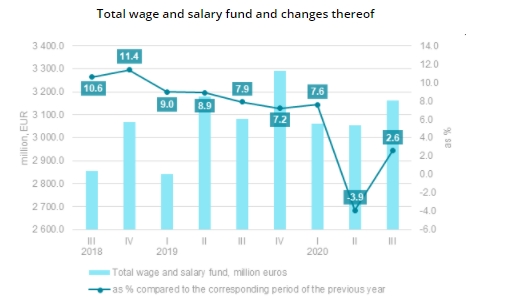
Compared to the 3rd quarter of 2019, in the 3rd quarter of 2020 compensation of employees at current prices increased by 2.7 %, of which total wages and salaries rose by 2.6 %, but employers' social security contributions – by 3.3 %.
The sharpest increase in compensation of employees was registered in information and communication services sectors – by 12.9 %, in agriculture, forestry and fishery in total – by 4.1 %, in industry sectors – by 4.0 %, but in services sectors – by 3.1 %.
Under the impact of pandemic, turnover of sectors affected by it reduced significantly, which, in turn, enhanced drop of gross operating surplus and mixed income by 11.3 %. Balance of taxes on production and imports and subsidies went up by 1.9 %.
Possible changes made by the government sector estimates, balance of payments and financial services sector, moreover indices of business services will be taken into account in the GDP calculations and balancing of the quarterly national accounts on the 85th day after the reference quarter. The updated information will be available in the CSB database on 23 December.
Time series of historical data and revision values of main GDP indicators are available for download in Excel files in the CSB database GDP metadata section.
More information on the GDP is available in CSB database short-term data section “Gross Domestic Product”.
Methodological information
Calculations of quarterly data of the GDP are made in line with the methodology of the European System of Accounts (ESA 2010). Main data sources used in calculations are:
Surveys of quarterly and monthly enterprises and institutions;
Data of the Labour Force Survey carried out by the CSB;
Data from the Ministry of Finance, the Treasury and the State Revenue Service;
Data from the Bank of Latvia and the Financial and Capital Market Commission;
Data from the Institute of Agricultural Resources and Economics.
The GDP statistics from production and expenditure approach is calculated at current prices (registration and calculations are made at the actual prices of the corresponding period) and constant prices. The indicators at constant prices are expressed at prices of the previous calendar year and prices of the reference year (chain-linked).
To calculate GDP at the prices of the previous calendar year the actual prices of the previous calendar year are used as a base and the “annual average” method (where each running quarter (or year) is calculated at the average prices of the previous year) is used. To make the calculations, various deflators are used. Both volume indices and price indices may be used as deflators. The following price indices are used: consumer price index, producer price index, construction cost index, services producer price index, price indices of agricultural products, export unit value index, import price index. The following volume indices are used: change in number of employees and change in natural indicators (e.g., in removals, passenger number, etc.).
To calculate GDP at the prices of the reference (base) year (currently, prices of 2015) the indices calculated from the GDP indicators at the prices of the previous year are used to chain-link the calculated volume indices with 2015.
GDP from the income approach is calculated at current prices only.
COVID-19 crisis in time-series analysis area at the moment is considered as occurrence that is not seasonal, therefore, impact of crisis is not excluded from the data when carrying out seasonal adjustment. It must be taken into account that during the crisis both unadjusted and seasonally adjusted data may be potentially exposed to greater data revisions than they were in a pre-crisis period. More information on seasonal adjustment during the COVID-19 crisis is available here.
The published data are adjusted in line with the Guidelines for CSB Revision Policy. The adjustments are made due to receipt of specified information as well as latest administrative data, inclusion of new economically active enterprises and institutions in surveys, specification of economic activity of sector of enterprises.
- 28.01.2022 BONO aims at a billion!
- 25.01.2021 Как банкиры 90-х делили «золотую милю» в Юрмале
- 30.12.2020 Накануне 25-летия Балтийский курс/The Baltic Course уходит с рынка деловых СМИ
- 30.12.2020 On the verge of its 25th anniversary, The Baltic Course leaves business media market
- 30.12.2020 Business Education Plus предлагает анонсы бизнес-обучений в январе-феврале 2021 года
- 30.12.2020 Hotels showing strong interest in providing self-isolation service
- 30.12.2020 EU to buy additional 100 mln doses of coronavirus vaccine
- 30.12.2020 ЕС закупит 100 млн. дополнительных доз вакцины Biontech и Pfizer
- 29.12.2020 В Rietumu и в этот раз создали особые праздничные открытки и календари 2021
- 29.12.2020 Latvia to impose curfew, state of emergency to be extended until February 7


 «The Baltic Course» Is Sold and Stays in Business!
