
Analytics, Energy, Industry, Lithuania, Markets and Companies
International Internet Magazine. Baltic States news & analytics
Monday, 23.03.2026, 23:07
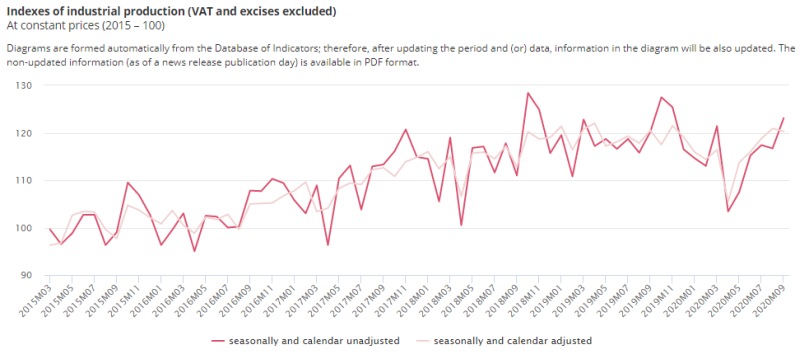
In September, industrial production in Lithuania decreased by 0.4%
 Print version
Over the month, seasonally and calendar adjusted, a decrease in production was observed for the manufacture of computer, electronic and optical products – 10.3% (unadjusted – 6.9%), manufacture of chemicals and chemical products – 8% (unadjusted – 11.2%), food products – 1.1% (unadjusted – 0.9%), manufacture of leather and related products – 16.2% (unadjusted – increased by 9.8%), manufacture of other transport vehicles and equipment – 7.6% (unadjusted – increased by 38.3%), manufacture of refined petroleum products – 1% (unadjusted – increased by 3.9%).
Changes in industrial production, at constant prices, growth, drop, (−), %
Economic activities | September 2020, against | January – September 2020, against | ||||
|---|---|---|---|---|---|---|
August 2020, seasonally and calendar adjusted | August 2020 | September 2019, calendar adjusted | September 2019 | January–September 2019, calendar adjusted | January–September 2019 | |
Industry (B–E) | –0.4 | 5.4 | –1.3 | 2.4 | –3.2 | –2.6 |
Mining and quarrying, manufacturing (B and C) | –0.7 | 5.3 | –1.8 | 2.0 | –3.5 | –2.9 |
Mining and quarrying (B) | 7.7 | 18.8 | 11.0 | 15.9 | 2.9 | 3.4 |
Manufacturing (C) | –0.8 | 5.1 | –2.0 | 1.9 | –3.5 | –2.9 |
Manufacturing (except for the manufacture of refined petroleum products) (C excl. C19) | –0.7 | 5.4 | 0.0 | 3.6 | –0.2 | 0.6 |
Electricity, gas, steam and air conditioning supply (D) | 2.6 | 8.7 | 9.1 | 9.1 | 0.4 | 0.4 |
Water supply, sewerage, waste management and remediation activities (only Division 36 of Section E – water collection, treatment and supply) | –2.1 | –4.0 | –1.2 | –0.9 | –2.6 | –2.4 |
Main industrial groupings |
|
|
|
|
|
|
Energy products | 3.8 | 5.1 | –5.0 | –2.7 | –13.2 | –13.0 |
Intermediate goods | –2.8 | 3.3 | 3.3 | 6.1 | 1.9 | 2.2 |
Capital goods | –1.5 | 16.1 | –10.0 | –7.2 | –0.6 | –1.3 |
Consumer durables | –1.3 | 4.4 | 5.3 | 10.6 | –4.9 | –1.8 |
Consumer non-durables | 3.4 | 4.2 | 1.2 | 4.3 | –0.7 | 0.3 |
Revised data for August 2020.
In January–September 2020, industrial production totalled almost EUR 15.6 billion at current prices and, compared to the same period in 2019, calendar adjusted, decreased by 3.2% at constant prices (unadjusted – 2.6%).
A news release on changes in industrial production in October 2020 is due on 23 November 2020.
For more information, see the Database of Indicators.
Statistical information is produced and disseminated pursuant to the European Statistics Code of Practice.
For more terms and explanations, see the Dictionary of Statistical Terms.
For the calculation of changes in industrial production, a producer price index for 2015 is used.
Industrial production — the value (VAT and excise excluded) of the sales of goods manufactured or manufacturing work carried out by an enterprise (sections B, C, D, E according to EVRK Rev. 2).
- 28.01.2022 BONO aims at a billion!
- 30.12.2020 Накануне 25-летия Балтийский курс/The Baltic Course уходит с рынка деловых СМИ
- 30.12.2020 On the verge of its 25th anniversary, The Baltic Course leaves business media market
- 30.12.2020 EU to buy additional 100 mln doses of coronavirus vaccine
- 30.12.2020 ЕС закупит 100 млн. дополнительных доз вакцины Biontech и Pfizer
- 29.12.2020 В Латвии вводят комендантский час, ЧС продлена до 7 февраля
- 29.12.2020 Latvia to impose curfew, state of emergency to be extended until February 7
- 29.12.2020 Linde Gas открывает завод в Кедайняйской СЭЗ
- 29.12.2020 Number of new companies registered in Estonia up in 2020
- 29.12.2020 Президент Литвы утвердил бюджет 2021 года


 «The Baltic Course» Is Sold and Stays in Business!
