
Analytics, Foreign trade , Latvia, Statistics
International Internet Magazine. Baltic States news & analytics
Friday, 31.07.2026, 10:54
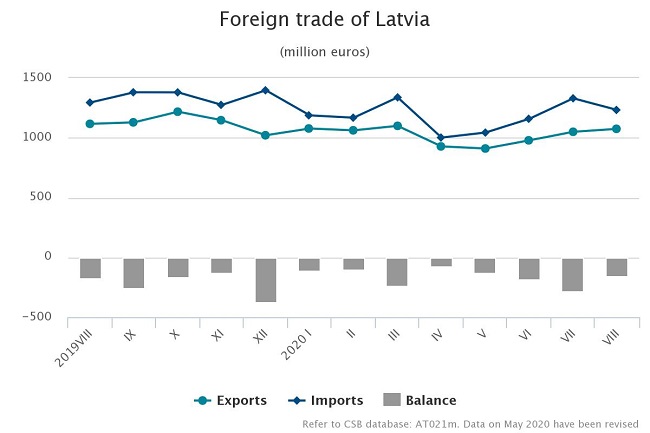
In August foreign trade turnover of Latvia was 4.3% less than a year ago
 Print version
During the
eight months of this year foreign trade turnover of Latvia at current prices
reached EUR 17.64 bn – EUR 1.3 bn or 6.8% less than in the
corresponding period of the previous year. The exports value constituted
EUR 8.18 bn (a drop of EUR 271.8 mln or 3.2%), whereas the
imports value comprised EUR 9.46 bn (a fall of EUR 1.02 bn
or 9.8%).
Calendar
and seasonally adjusted data show that, compared to August 2019, in
August 2020 the exports value at current prices went up by 0.5%, but the
imports value – down by 3%, whereas, compared to the previous month, the
exports value went up by 3.7% ,but the imports value – down by 1.5%.
Main
changes in exports in August 2020, compared to August 2019:
- exports of machinery and mechanical appliances;
electrical equipment up by EUR 17.6 mln or 9.8%,
- exports of wood and articles of wood down by
EUR 12.5 mln or 6.9%,
- exports of vehicles and associated transport equipment down by
EUR 11.2 mln or 19.7%,
- exports of mineral products down by EUR 10.8 mln or 21%,
- exports of base metals and articles of base metals down by
EUR 5.5 mln or 6.4%.
Main
changes in imports in August 2020, compared to August 2019:
- imports of machinery and mechanical appliances;
electrical equipment up by EUR 29.4 mln or 11.8%,
- imports of mineral products down by EUR 57.9 mln or
37.2%,
- imports of vehicles and associated transport equipment down by
EUR 27.8 mln or 27.7%,
- imports of plastics and articles thereof down by
EUR 6.3 mln or 8.2%,
- imports of textiles and textile articles down by EUR 5.5 mln or 10%.
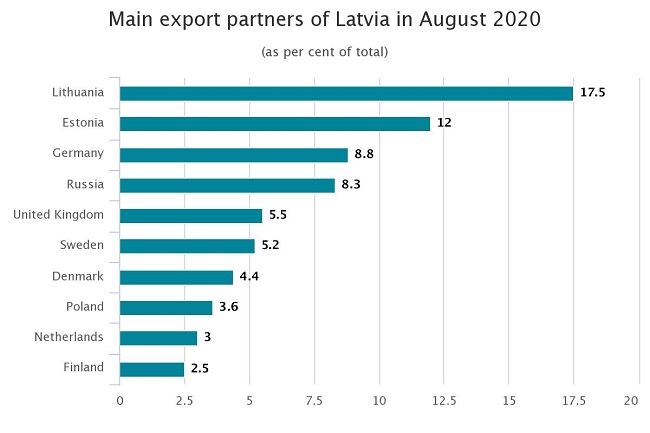
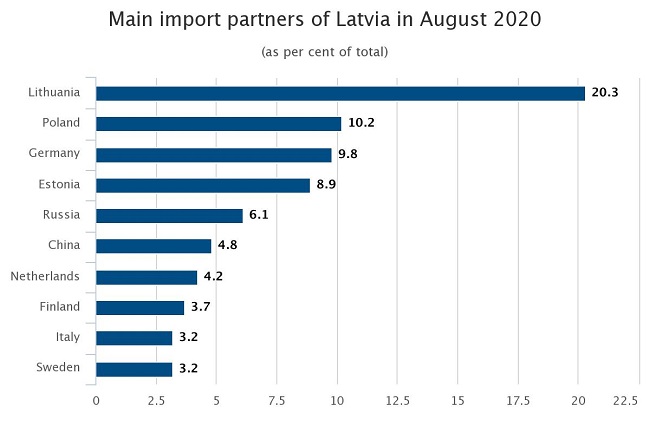
- In August, the main export partners of Latvia in trade with EU countries were Lithuania (17.5% of total exports), Estonia (12%), Germany (8.8%) and Sweden (5.2%), whereas the main import partners were Lithuania (20.3% of total imports), Poland (10.2%), Germany (9.8%) and Estonia (8.9%). Russia was the main partner in trade with third countries; its share in total Latvian exports in August accounted for 8.3%, whereas in imports – for 6.1%.
In August 2020, compared to August 2019, share of
the European Union countries in total exports value increased by 1.2 percentage
points, but in imports value – fell by 0.2 percentage points. Share of CIS
countries in exports fell by 1.2 percentage points, but in imports – by
1.6 percentage points.
Foreign
trade of Latvia in August 2020 by country group
(at current prices)
|
|
Exports |
Imports |
||||
|
|
million EUR |
% of total |
changes
as %, compared to August 2019 |
million EUR |
% of total |
changes
as %, compared to August 2019 |
|
Total |
1 074.6 |
100 |
-3.7 |
1 232.4 |
100 |
-4.8 |
|
European Union countries* |
717.1 |
66.7 |
-1.9 |
941.5 |
76.4 |
-5.0 |
|
euro area countries |
551.2 |
51.3 |
-0.6 |
709.2 |
57.6 |
-6.6 |
|
CIS countries |
135.0 |
12.6 |
-12.4 |
121.1 |
9.8 |
-17.9 |
|
other countries |
222.5 |
20.7 |
-3.8 |
169.8 |
13.8 |
8.9 |
*The United Kingdom is not included in the European Union.
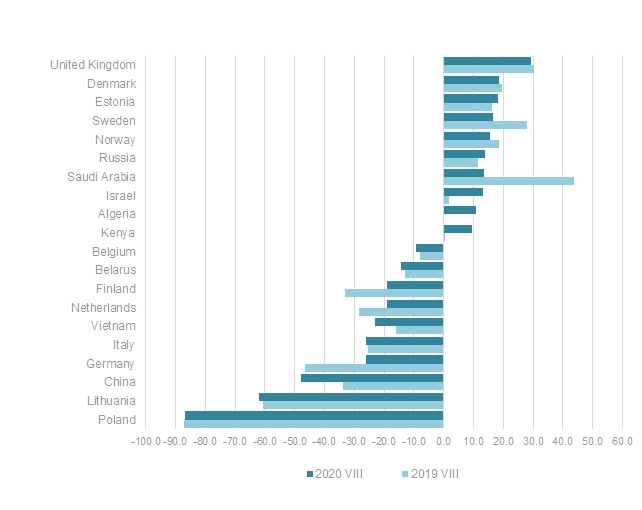
In August 2020 foreign trade balance of Latvia was
positive with 114 partner countries, as exports value of goods exceeded
imports value of goods. It was negative in trade with 44 countries.
Balance of foreign trade of Latvia
(difference between value of goods exports and imports, mln euros)
Rise of exports of miscellaneous grains, seeds and fruit; industrial or medicinal plants in August 2020, compared to August 2019, was mostly affected by increase of exports of rape and colza seeds by EUR 14.3 mln or 60.2%. Exports of cereals fell as exports of wheat and meslin reduced by EUR 14.5 mln or 20.7%. In turn, compared to July 2020, exports of wheat and meslin increased significantly (by EUR 54 mln), which mostly was exported to Saudi Arabia (EUR 12.9 mln), Algeria (EUR 10.7 mln) and Israel (EUR 10.2 mln).
Main
commodities in exports of Latvia in August 2020
(at current prices)
|
|
thousand EUR |
% of total |
Changes
as %, compared to |
||
|
August 2019 |
July 2020 |
average
of previous 12 months |
|||
|
Total |
1 074 607 |
100 |
-3.7 |
2.4 |
1.3 |
|
168 627 |
15.7 |
-6.9 |
-8.5 |
-3.9 |
|
|
131 927 |
12.3 |
13.6 |
-10.7 |
6.9 |
|
|
66 214 |
6.2 |
2.8 |
-7.8 |
1.6 |
|
|
58 192 |
5.4 |
-23.8 |
21.9 times |
31.6 |
|
|
52 729 |
4.9 |
-10.1 |
32.7 |
3.2 |
|
|
vehicles
other than railway or tramway rolling stock, and parts and accessories
thereof |
40 270 |
3.7 |
-22.8 |
-20.8 |
-18.4 |
|
miscellaneous
grains, seeds and fruit; industrial or medicinal plants |
39 919 |
3.7 |
50.9 |
6.4 times |
2.8 times |
|
furniture,
other furnishing articles; prefabricated buildings |
35 277 |
3.3 |
8.2 |
5.1 |
4.0 |
|
35 155 |
3.3 |
-11.3 |
-8.2 |
-5.6 |
|
|
mineral
fuels, mineral oils and products of their distillation |
34 828 |
3.2 |
-23.1 |
-2.7 |
-14.1 |
The rise in
imports of electrical machinery and equipment in August 2020, as compared
to August 2019, was facilitated by an increase in imports of mobile
telephones by EUR 12.7 mln or 36.6%. In turn, reduction in imports of
mineral fuels, mineral oils and products of their distillation was mostly influenced by decrease in
imports of diesel oil by EUR 22.2 mln or 36.1%.
Main
commodities in imports of Latvia in August 2020
(at current prices)
|
|
thousand EUR |
% of total |
Changes
as %, compared to |
||
|
August 2019 |
July 2020 |
average
of previous 12 months |
|||
|
Total |
1 232 370 |
100 |
-4.8 |
-7.3 |
-1.1 |
|
162 942 |
13.2 |
20.7 |
-2.5 |
10.9 |
|
|
115 555 |
9.4 |
1.3 |
-7.9 |
-4.3 |
|
|
mineral fuels, mineral oils and products of their
distillation |
92 198 |
7.5 |
-38.3 |
-7.6 |
0.8 |
|
vehicles other than railway or tramway rolling stock, and
parts and accessories thereof |
69 971 |
5.7 |
-25.7 |
-26.8 |
-23.7 |
|
56 234 |
4.6 |
4.0 |
-0.1 |
21.7 |
|
|
53 090 |
4.3 |
9.3 |
-5.9 |
-1.0 |
|
|
49 399 |
4.0 |
-4.7 |
-15.7 |
-6.0 |
|
|
48 080 |
3.9 |
1.7 |
0.8 |
5.3 |
|
|
38 688 |
3.1 |
5.6 |
-31.1 |
-11.2 |
|
|
35 838 |
2.9 |
-8.1 |
-5.3 |
13.4 |
|
- 28.01.2022 BONO aims at a billion!
- 25.01.2021 Как банкиры 90-х делили «золотую милю» в Юрмале
- 30.12.2020 Накануне 25-летия Балтийский курс/The Baltic Course уходит с рынка деловых СМИ
- 30.12.2020 On the verge of its 25th anniversary, The Baltic Course leaves business media market
- 30.12.2020 Business Education Plus предлагает анонсы бизнес-обучений в январе-феврале 2021 года
- 30.12.2020 Hotels showing strong interest in providing self-isolation service
- 29.12.2020 В Латвии вводят комендантский час, ЧС продлена до 7 февраля
- 29.12.2020 В Rietumu и в этот раз создали особые праздничные открытки и календари 2021
- 29.12.2020 Latvia to impose curfew, state of emergency to be extended until February 7
- 29.12.2020 18-19 января Наталия Сафонова проводит семинар "Управленческий учет во власти собственника"


 «The Baltic Course» Is Sold and Stays in Business!
