
Analytics, Economics, Inflation, Latvia, Statistics
International Internet Magazine. Baltic States news & analytics
Monday, 23.03.2026, 18:45
Latvia records 0.2% deflation in August
 Print version
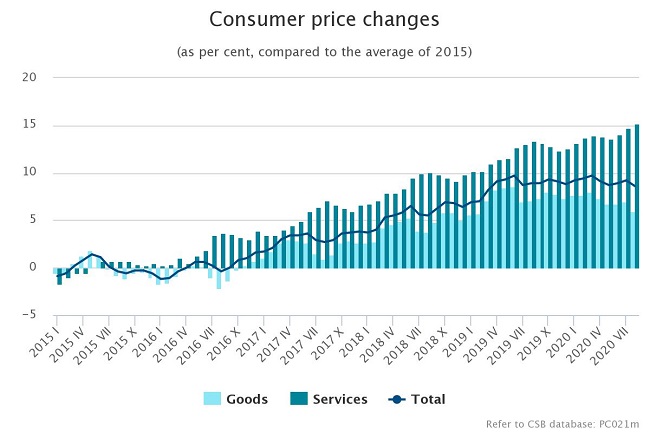
Compared to 2015, in August 2020 consumer prices were
8.6% higher. Prices of goods increased by 6.0% and prices of services by 15.2%.
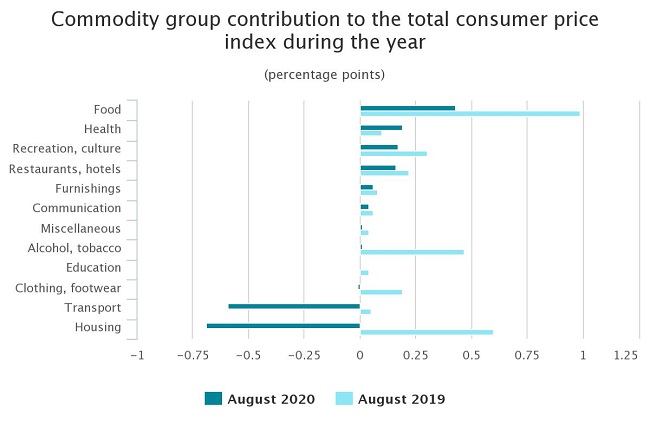
Compared to August 2019, in August 2020 the
average level of consumer prices was mainly influenced by the drop in prices of
goods and services related to housing, goods and services related to transport,
clothing and footwear, as well as rise in prices of food and non-alcoholic
beverages, health care, goods and services related to recreation and culture,
restaurant and hotel services.
Over the
year, prices within the group of food and non-alcoholic beverages increased by
2.0%. Prices of fresh fruit (up by 23.8%), including of apples, oranges and
pears had the most significant upward impact on the average price level within
the group. Upturn was registered also in prices of dried, salted or smoked meat
(of 7.3%) and meat products (5.0 %). Increase was recorded in prices of
buckwheat (of 20.7%), breakfast cereals (12.0%), bakery products (1.8%), chocolate
(3.9%), ice cream (4.7%) and bread (1.2%). Decline, in turn, was registered in
prices of fresh vegetables (of 7.1%), potatoes (15.3%), poultry (3.3%), milk
(5.1%) and milk products (1.5%).
The average
level of clothing and footwear prices fell by 0.3%. Prices of garments reduced
on average by 0.3%, but of footwear – by 0.1%.
Prices of
goods and services related to housing fell by 4.2%, which was mainly affected
by price drop of heat energy, natural gas, electricity, solid fuels and rentals
for housing.
Within the
health care group, the average level of prices rose by 3.2%, which was mainly
influenced by the increase in prices of dental services, prices in general
medical practice, as well as prices in medical specialist practice. Downturn was
registered in prices of pharmaceutical products.
Prices of
goods and services related to transport declined by 4.3%, which was affected by
the drop in prices of fuels for transport (of 11.5%), mainly diesel (of 12.1%).
Prices of petrol reduced by 11.1% and of auto gas – by 9.4%. Increase over the
year was observed in prices of passenger transport by road, maintenance and
repair of personal transport equipment.
Goods and
services related to recreation and culture became more expensive by 2.0%.
During the year, average level of prices increased for recreation and sports
services, flowers, newspapers and magazines.
The average
level of restaurant and hotel service prices went up by 3.0 %. Price rise
was mainly affected by catering services, as the average level of restaurant
and café service prices increased by 2.3% and that of canteen services by 4.9%.
The most
significant downturns among other commodity groups were recorded in prices of
motor vehicle insurance, spirits and beer, while upturns were recorded in
prices of tobacco products, articles for personal hygiene and beauty products.
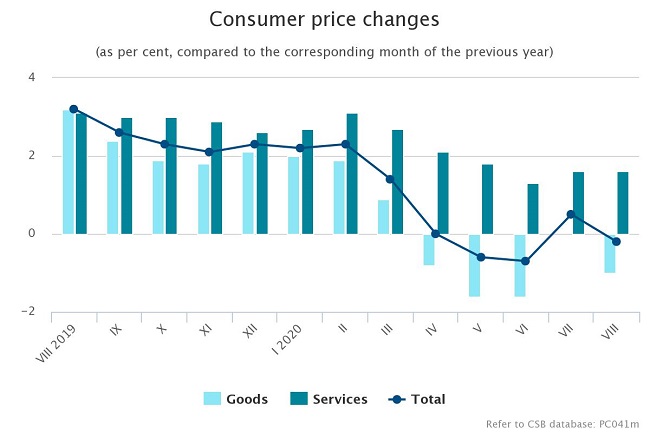
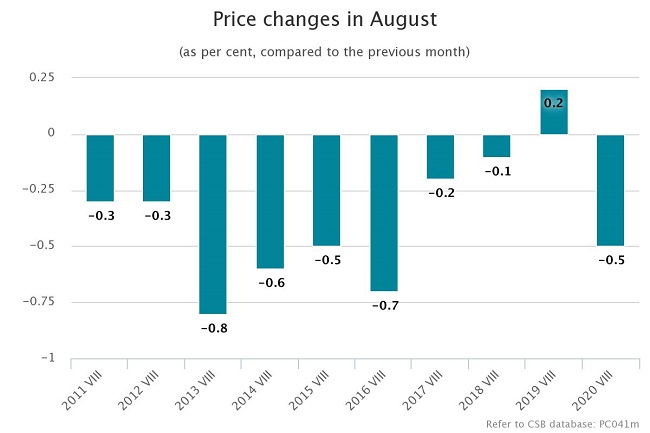
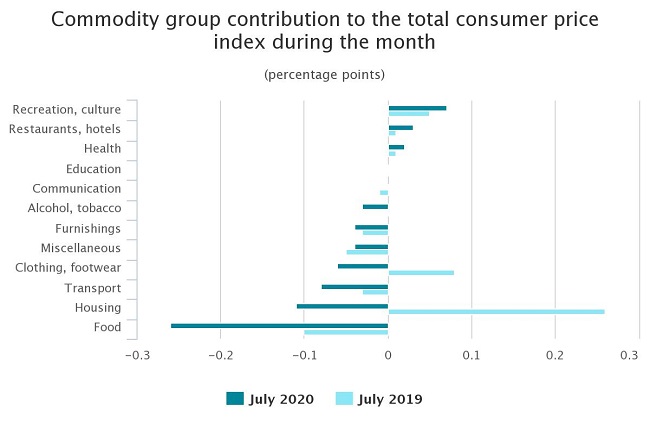
During the month, the average level of consumer prices fell by 0.5%
Compared to
July 2020, in August 2020 the average level of consumer prices
reduced by 0.5%. The average level of prices of goods fell by 0.9%, while of
service prices – rose by 0.4%.
The
greatest pressure on the price changes was put by the drop in prices of food
and non-alcoholic beverages, goods and services related to housing, goods and
services related to transport, clothing and footwear, as well as by the rise in
prices of goods and services related to recreation and culture.
Over the
month, prices of food and non-alcoholic beverages declined by 1.2%. Under the
influence of seasonal factors price drop of fresh vegetables (of 9.6%) and
potatoes (23.4%) had the strongest downward influence on the average price
level within the group. Prices of poultry reduced by 5.6%, of milk by 3.3%, of
pork by 1.9%, of pasta products by 5.5%, of cheese and curd by 1.2%, which was
mainly affected by the sales campaigns. In turn, prices of fresh fruit went up
by 3.5%, of bakery products by 1.1%, of butter by 3.5% and of fresh or chilled
fish by 4.8%.
The average
level of prices within clothing and footwear group fell by 1.0%. Price drop for
footwear (of 3.4%) and garments (0.5%) mainly was influenced by discounts.
Average
price level of goods and services related to housing dropped by 0.7%, which was
mainly influenced by lower heat energy tariffs in Riga, reducing the average
level of heat energy prices by 4.5%. Price drop influenced by discounts was
observed for materials for the maintenance and repairs of the dwelling (1.1%).
In turn, an increase was registered in rentals for housing (on average of 1.9%),
water supply (2.6%) and sewage collection (2.7%).
Prices of
goods and services related to transport fell on average by 0.6%. Prices of
fuels for transport went down by 0.5%, of which prices of diesel by 0.6%, of
petrol by – 0.6%, but of auto gas – went up by 0.2%. Prices of passenger
transport by air reduced.
The average
level of prices on goods and services related to recreation and culture rose by
0.8%, which was mainly influenced by the increase in prices of personal
computers and cameras. Prices of flowers, stationery and drawing materials went
down.
Among other
commodity groups, the most notable drop was registered in prices of articles
for personal hygiene and beauty products, household cleaning and maintenance
products, wine and beer. In turn, prices of dental services went up.
Price
changes by commodity group
(as per cent)
|
Commodity
group |
Price
changes in August 2020, compared to: |
||
|
August 2019 |
December 2019 |
July 2020 |
|
|
Total |
-0.2 |
-0.2 |
-0.5 |
|
food |
2.0 |
1.8 |
-1.2 |
|
alcohol, tobacco |
0.2 |
2.0 |
-0.4 |
|
clothing, footwear |
-0.3 |
-3.0 |
-1.0 |
|
housing |
-4.2 |
-4.1 |
-0.7 |
|
furnishings |
1.5 |
1.7 |
-0.9 |
|
health |
3.2 |
2.8 |
0.3 |
|
transport |
-4.3 |
-4.3 |
-0.6 |
|
communication |
1.1 |
1.2 |
0.0 |
|
recreation, culture |
2.0 |
3.0 |
0.8 |
|
education |
-0.1 |
0.2 |
-0.1 |
|
restaurants, hotels |
3.0 |
3.6 |
0.5 |
|
miscellaneous |
0.3 |
0.1 |
-0.8 |
COVID-19 influence on consumer price index in August
In August
total number of imputations related to Covid-19 dropped to 0.7%, which is 1.2%
of total household consumption expenditure.
Significant
Covid-19 impact remained in two ECOICOP (European Classification of Individual
Consumption according to Purpose) sub-classes – Passenger transport by sea
(share of imputation 100%); Package holidays (share of imputation 91%).
Imputations were calculated by the methods mentioned below in accordance with
recommendations of Eurostat for compilation of indices under the impact of
Covid-19:
- Imputation with the annual rate
of change of all reliable price indices
(in August 2020 annual consumer price index of all "reliable” indices constituted 99.8); - Imputation based on available
prices for the same product.
Indices
with significant number of imputations (> 50%) caused by Covid-19 and thus
having lower quality in the CSB database are indicated with "u".
- 28.01.2022 BONO aims at a billion!
- 25.01.2021 Как банкиры 90-х делили «золотую милю» в Юрмале
- 30.12.2020 Накануне 25-летия Балтийский курс/The Baltic Course уходит с рынка деловых СМИ
- 30.12.2020 On the verge of its 25th anniversary, The Baltic Course leaves business media market
- 30.12.2020 Business Education Plus предлагает анонсы бизнес-обучений в январе-феврале 2021 года
- 30.12.2020 Hotels showing strong interest in providing self-isolation service
- 29.12.2020 В Латвии вводят комендантский час, ЧС продлена до 7 февраля
- 29.12.2020 В Rietumu и в этот раз создали особые праздничные открытки и календари 2021
- 29.12.2020 Latvia to impose curfew, state of emergency to be extended until February 7
- 29.12.2020 18-19 января Наталия Сафонова проводит семинар "Управленческий учет во власти собственника"


 «The Baltic Course» Is Sold and Stays in Business!
