
Analytics, Economics, Financial Services, GDP, Latvia
International Internet Magazine. Baltic States news & analytics
Saturday, 27.06.2026, 16:18
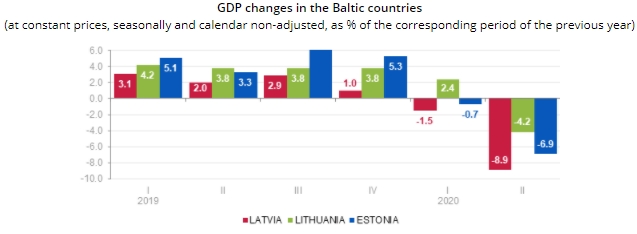
GDP in Latvia dropped by 8.9 % in Q2
 Print version
In the 2nd quarter GDP at constant prices was EUR 6.9 billion. As compared to the previous quarter, GDP fell by 6.5 % (according to seasonally and calendar adjusted data).
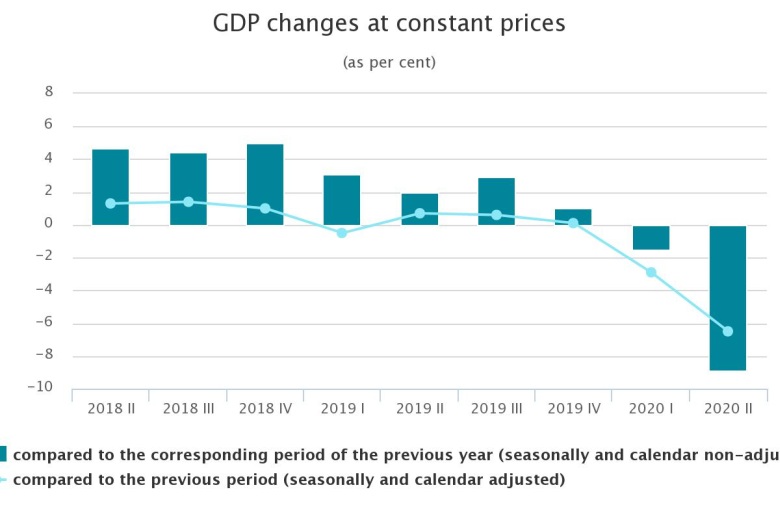
In the 2nd quarter of 2020 GDP at current prices comprised EUR 6 908.5 million.
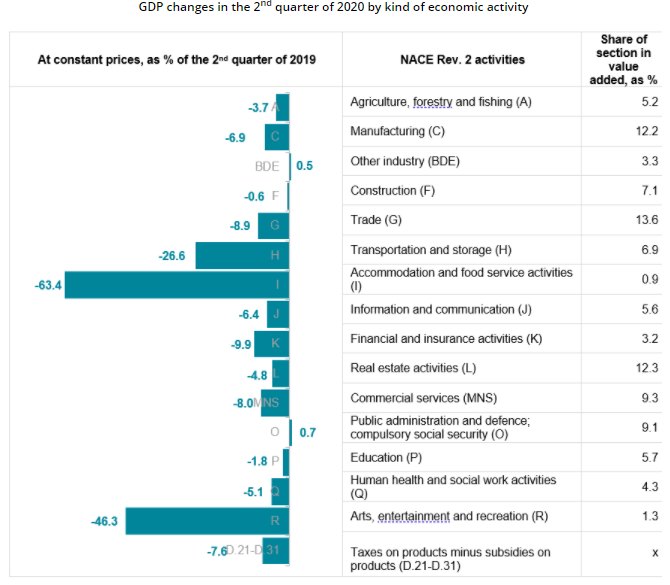
In the 2nd quarter of 2020, compared to the 2nd quarter of 2019, production growth in agricultural sector comprised 2.1 % (growth of 4.9 % in crop production, drop of 3.7 % in livestock production), but in forestry and fishing volume reduction was observed.
In manufacturing volume decreased by 6.9 % (reduction was observed in 16 out of 22 manufacturing sectors). In the largest manufacturing sectors decrease was observed: in timber production – of 1.7 %, manufacturing of food products – 3.8 %, manufacture of non-metallic mineral products – 6.5 %, manufacture of fabricated metal products – 7.8 %. Growth in manufacturing was observed in manufacture of computer, electronic and optical products – of 4.9 %, manufacture of chemicals and chemical products – 18.6 %.
Electricity, gas, steam and air conditioning supply rose by 2.7 %. Production and distribution of electricity fell by 0.3 %, but in steam and air conditioning supply increase of 24.2 % was observed (due to longer heating season).
Reduction in construction production of 0.6 % was affected both by COVID-19 pandemic, and by the lack of voluminous construction objects. Out of construction enterprises surveyed in 5 % of enterprises construction work was not carried out in the 2nd quarter, and 6 % of respondents indicated on reduction in construction demand due to the impact of COVID-19. Volume of building construction decreased by 5.0 %, but of civil engineering – by 7.7 % (of which, construction of roads and railways fell by 15.6 % and civil engineering – by 46.6 %; but increase of 27.0 % was registered in construction of utility projects. But specialized construction activities were carried out 12.3 % more, which was promoted by rise in demolition and site preparation (of 26.4 %), electrical, plumbing and other construction installation activities (16.5 %) and other specialized activities (27.7 %). Drop of 8.2 % was observed in building completion and finishing.
Retail trade reduced by 1.6 %, of which retail sale of food products increased by 1.0 %. Affected by significant price drop retail sale of automotive fuel rose by 1.8 %, but retail sale of non-food products, except automotive fuel, fell by 5.1 %. Wholesale, retail trade and repair of motor vehicles and motorcycles decreased significantly (of 29.2 %), as due to uncertainty of customers regarding possible consequences left on economy by COVID-19, purchase of transport vehicles was postponed. In the uncertain economic situation entrepreneurs and private persons did not want to take up new financial obligations.
In wholesale trade drop comprised 11.7 %. As compared to the 2nd quarter of the previous year, increase was observed only in one sector – wholesale of information and communication equipment of 19.3 %, which was affected by the need to adapt to requirements for remote work and studies during COVID-19 pandemic.
Restrictions imposed by governments of Latvia and other countries for limitation of COVID-19 pandemic significantly affected activity of transport and storage sectors – drop of 26.6 %, of which, drop in volume of provision of services in storage and transport auxiliary services reached 21.0 %, in passenger traffic – 69.3 %, in postal and courier activities – 4.5 %, in freight transport – 16.4 %.
Restrictions imposed for reduction of COVID-19 pandemic fiercely affected services provided by accommodation and catering sectors – fall of 63.4 %, of which in accommodation – of 82.2 %, in catering – of 55.0 %.
Services of information and communication sectors reduced by 6.4 %, of which of 9.7 % in telecommunication services, of 6.1 % – in information services and of 2.4 % – in computer programming and consulting.
In financial and insurance sector decrease comprised 9.9 %, which was promoted by drop in financial service activities and increase in insurance, reinsurance and pension funding sector, as well as in activities auxiliary to financial services and insurance activities. Fall in financial service activities was affected by drop in commission income by credit institutions (from services for card payments, from settlements and payments, from account fees and asset management) and formation of losses on transactions with financial instruments (in contrast to profit in the corresponding period of the previous year). Growth in insurance, reinsurance and pension funding sector was promoted by results of activity of private pension plans.
Decline of 3.3 % in professional, scientific and technical activities sectors was affected by 2.9 % less services provided in activities of head offices, management consultancy activities, architectural and engineering services, in technical testing and analysis – by 6.8 %, volume of services provided by advertising and market research reduced by 16.9 %. However, growth in legal and accounting activities of 7.1 % had positive impact on the development of sector.
Administrative and support service activities reduced by 11.4 %, which was affected by significant drop of 73.3 % in travel agency, tour operator reservation service and related activities, of 11.9 % – in labour recruitment and provision of personnel sector, of 15.2 % – in security and investigation activities, of 2.2 % – in rental and leasing services sector.
One of services sectors that was hit the hardest by COVID-19 pandemic was arts, entertainment and recreation, where drop against the corresponding period of the previous year reached 46.3 %.
The volume of taxes on products (value added tax, excise and customs taxes) decreased by 7.6 %. Decrease was observed both in value added tax and excise duty revenues. Volume of taxes on products was affected by increase of rates on several positions of taxes.
As compared to GDP flash estimate, total value added of sectors did not change, but the latest information on taxes on products concerning the period affected the overall estimate positively and increased GDP by 0.9 percentage points.
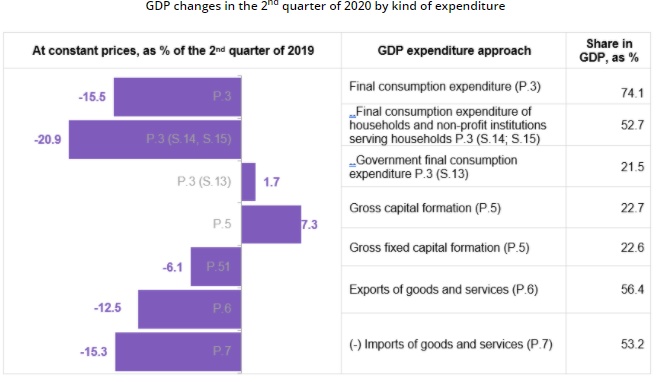
In the 2nd quarter of 2020 household expenses for final consumption, compared to the corresponding period of the previous year, reduced by 21.4 %. Measures taken by the government to limit spread of COVID-19 virus significantly affected household expenditure in two out of traditionally largest expenditure groups: transport (pubic transport, purchase and exploitation of transport vehicles) and recreational and cultural events. Expenditure in these final consumption groups reduced by 26.5 % and 74.5 %, respectively. Affected by the pandemic, households also spent 63.2 % less on accommodation and catering services. Drop of 1.6 % was also observed in household expenses on dwelling, which was mainly determined by reduction in expenses for water supply, electricity, gas and other fuels.
Government final consumption expenditure grew by 1.7 %.
Investment in gross fixed capital fell by 6.1 %. Investment in dwellings and other buildings and structures reduced by 0.6 %, which was affected by implementation of precautionary measures at construction sites, delay of raw materials, as well as lack of new voluminous objects. Investment in machinery and equipment (of which in transport vehicles) reduced by 12.6 %, but investment in intellectual property products – fell by 9.2 %.
Exports of goods and services decreased by 12.5 %, of which exports of goods (75 % of total exports) – by 4.0 %, exports of services – by 31.2 %, which was mainly determined by drop of exports of tourism services caused by COVID-19 pandemic.
Imports of goods and services decreased by 15.3 %. Imports of goods, which comprises 86 % of total imports, has dropped by 11.8 %, but imports of services – by 32.5 %. Decline in imports of services was mainly determined by drop in imports of transport and tourism services.
Income
approach
(at current prices,
seasonally and calendar non-adjusted data)
Compared to the 2nd quarter of 2019, in the 2nd quarter of 2020 compensation of employees at current prices fell by 3.9 %, of which total wages and salaries reduced by 3.7 %, but employers' social security contributions fell by 4.6 %.
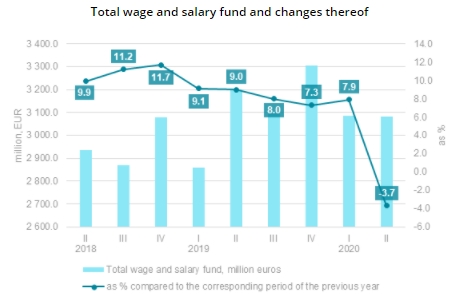
Total compensation of employees reduced in commercial services sectors – by 4.4%, but in services sectors in total – by 3.7%.
Gross operating surplus and mixed income decreased by 17.0 %, whereas the balance of taxes on production and imports and subsidies went down by 11.8 %.
GDP data revision is expected due to the update of GDP time-series (starting with the data on 1995) and integration of 2018 data, which were calculated using data sources of annual periodicity, into time-series. The updated information will be available in the CSB database on 30 September.
Time series of historical data and revision values of main GDP indicators are available for download in Excel files in the CSB database GDP metadata section.
More information on the GDP is available in CSB quarterly databases “Gross Domestic Product”.
Methodological information
Calculations of quarterly data of the Gross Domestic Product (GDP) are made in line with the methodology of the European System of Accounts (ESA 2010). Main data sources used in calculations are:
Surveys of quarterly and monthly enterprises and institutions;
Labour Force Survey;
Data from the Ministry of Finance, the Treasury and the State Revenue Service;
Data from the Bank of Latvia and the Financial and Capital Market Commission;
Data from the Institute of Agricultural Resources and Economics.
The GDP statistics from production and expenditure approach is calculated at current prices (registration and calculations are made at the actual prices of the corresponding period) and constant prices. The indicators at constant prices are expressed at prices of the previous calendar year and prices of the reference year (chain-linked).
To calculate GDP at the prices of the previous calendar year the actual prices of the previous calendar year are used as a base and the “annual average” method (where each running quarter (or year) is calculated at the average prices of the previous year) is used. To make the calculations, various deflators are used. Both volume indices and price indices may be used as deflators. The following price indices are used: consumer price index, producer price index, construction cost index, services producer price index, price indices of agricultural products, export unit value index, import unit value index. The following volume indices are used: change in number of employees and change in natural indicators (e.g., in removals, passenger number, freights, etc.).
To calculate GDP at the prices of the reference (base) year (currently, prices of 2015) the indices calculated from the GDP indicators at the prices of the previous year are used to chain-link the calculated volume indices with 2015.
GDP from the income approach is calculated at current prices only.
COVID-19 crisis in time-series analysis area at the moment is considered as occurrence that is not seasonal, therefore, impact of crisis is not excluded from the data when carrying out seasonal adjustment. It must be taken into account that during the crisis both unadjusted and seasonally adjusted data may be potentially exposed to greater data revisions than they were in a pre-crisis period. More information on seasonal adjustment during the COVID-19 crisis is available at https://github.com/CSBLatvia/SA-COVID-19-public/blob/master/SA-COVID-19-EN.md
The published data are adjusted in line with the Guidelines for CSB Revision Policy. The adjustments are made due to receipt of specified information as well as latest administrative data, inclusion of new economically active enterprises and institutions in surveys, specification of economic activity of sector of enterprises.
- 28.01.2022 BONO aims at a billion!
- 25.01.2021 Как банкиры 90-х делили «золотую милю» в Юрмале
- 30.12.2020 Накануне 25-летия Балтийский курс/The Baltic Course уходит с рынка деловых СМИ
- 30.12.2020 On the verge of its 25th anniversary, The Baltic Course leaves business media market
- 30.12.2020 Business Education Plus предлагает анонсы бизнес-обучений в январе-феврале 2021 года
- 30.12.2020 Hotels showing strong interest in providing self-isolation service
- 29.12.2020 В Латвии вводят комендантский час, ЧС продлена до 7 февраля
- 29.12.2020 В Rietumu и в этот раз создали особые праздничные открытки и календари 2021
- 29.12.2020 Latvia to impose curfew, state of emergency to be extended until February 7
- 29.12.2020 18-19 января Наталия Сафонова проводит семинар "Управленческий учет во власти собственника"


 «The Baltic Course» Is Sold and Stays in Business!
