
Analytics, Latvia, Statistics, Wages
International Internet Magazine. Baltic States news & analytics
Friday, 13.03.2026, 21:38
Ship captains, airplane pilots are among best paid jobs in Latvia
 Print version
Structure of Earnings Survey is carried out once in four years in all European Union member states, according to a common methodology, which ensures comparability of indicators and simultaneously avoiding excessive burden on data providers.
|
Name
and code of the occupational group according to Classification of Occupations
of the Republic of Latvia |
Average
gross monthly wages and salaries in 2018, in EUR |
|
Ship and aircraft controllers and technicians (315) |
3 279 |
|
Information and communications technology service
managers (133) |
2 931 |
|
Software and applications developers and analysts
(251) |
2 644 |
|
Medical doctors (221) |
2 543 |
|
Legal professionals (261) |
2 162 |
|
Database and network professionals (252) |
2 106 |
|
Ships' deck crews and related workers (835) |
2 034 |
|
Sales, marketing and public relations professionals
(243) |
2 021 |
|
Sales, marketing and development managers (122) |
1 990 |
|
Hotel and restaurant managers (141) |
1 961 |
Street vendors had the smallest wages and salaries
Sellers selling miscellaneous goods (except food) on the street, stadiums, cinemas, theatres and other public places, on average earned EUR 518 a month before taxes, which is the lowest indicator among all occupational groups. Child care workers and teachers’ aides also had the lowest wages and salaries – EUR 588, refuse collectors – EUR 621, food preparation assistants – EUR 625, domestic, hotel and office cleaners and helpers – EUR 632, as well as clothing manufacturers, personal care workers, fishery workers, hunters and trappers, whose wages and salaries before taxes comprised less than EUR 700.
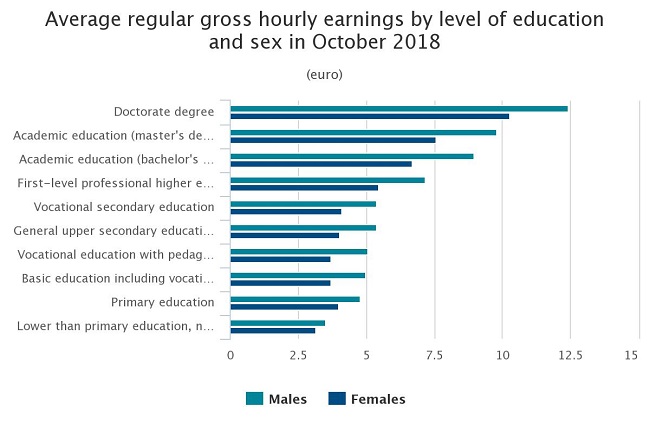
Employees with higher education had better wages and salaries
Employees of both sexes with higher education were better paid than employees with secondary and basic, also with professional education, however, females earned less than males in all groups of educational attainment in 2018.
Males and females with doctorate degree (EUR 12.40 and 10.25, respectively) and with master's degree (EUR 9.80 and 7.57, respectively) had the highest average hourly remuneration. Employees with education that is lower than primary education, average hourly remuneration comprised EUR 3.50 for males and EUR 3.14 – for females.
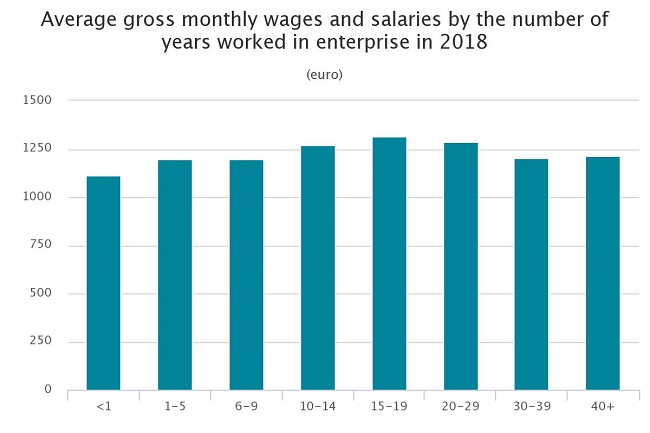
Size of wages and salaries also depend on the number of years worked in the enterprise or institution
In 2018 employees with service increment from 15 to 19 years had the highest average monthly wages and salaries, but employees that had worked for less than one year – the lowest. Average wages and salaries did not differ significantly of employees with 1 to 9 years of work experience and of those who had worked 30 and more years in one enterprise or institution.
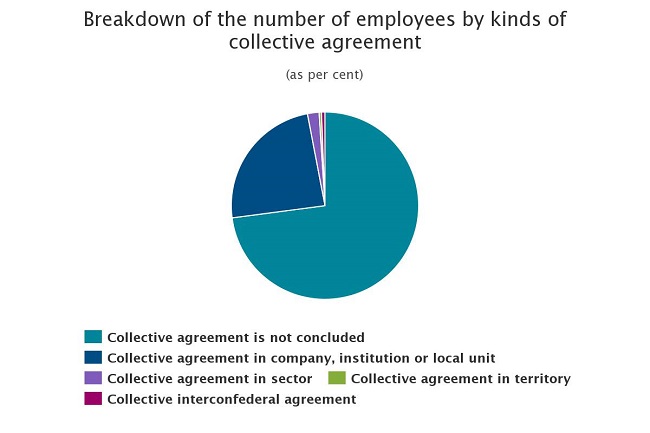
More than one fourth of employees have collective agreement
Structure of Earnings Survey also compiled information on collective agreements and overtime worked and paid. Collective agreement can be suggested both by employer and by representatives of employees or organizations. When concluding collective agreement, employees gain more favourable employment conditions as compared to the corresponding normative acts in force.
In 2018, 27% of employees were included in collective agreement. The largest share of covered employees of the total number of employees in the sector was in education (64.0%), health and social care (61.3%) and energy (65.1%) sectors.
Plant and machine operators mostly are carrying out paid overtime work
In 2018, 5.1% of the total number of employees were working paid overtime. According to the data provided by employers, paid overtime was mostly indicated for employees of plant and machine operators and assemblers major occupational groups – overtime was registered for 11.8% of employees. The least paid overtime is indicated for managers (1.4%) and professionals (2.4%).
Breakdown
of the number of employees by major occupational groups with pay for overtime
|
|
Number of employees, thousand |
of which, with overtime, thousand |
Share, % |
|
TOTAL |
904.5 |
46.1 |
5.1 |
|
Managers |
119.4 |
1.6 |
1.4 |
|
Professionals |
179.4 |
4.2 |
2.4 |
|
Specialists |
130.7 |
4.3 |
3.3 |
|
Servants |
55.1 |
4.1 |
7.5 |
|
Service and sales workers |
120.7 |
9.4 |
7.8 |
|
Skilled agricultural, forestry, and fishery workers |
5.1 |
0.3 |
5.8 |
|
Craft and related trades workers |
91.5 |
6.6 |
7.2 |
|
Plant and machine operators and assemblers |
85.0 |
10.0 |
11.8 |
|
Elementary occupations |
109.6 |
5.5 |
5.0 |
- 28.01.2022 BONO aims at a billion!
- 25.01.2021 Как банкиры 90-х делили «золотую милю» в Юрмале
- 30.12.2020 Накануне 25-летия Балтийский курс/The Baltic Course уходит с рынка деловых СМИ
- 30.12.2020 On the verge of its 25th anniversary, The Baltic Course leaves business media market
- 30.12.2020 Business Education Plus предлагает анонсы бизнес-обучений в январе-феврале 2021 года
- 30.12.2020 Hotels showing strong interest in providing self-isolation service
- 29.12.2020 В Латвии вводят комендантский час, ЧС продлена до 7 февраля
- 29.12.2020 В Rietumu и в этот раз создали особые праздничные открытки и календари 2021
- 29.12.2020 Latvia to impose curfew, state of emergency to be extended until February 7
- 29.12.2020 18-19 января Наталия Сафонова проводит семинар "Управленческий учет во власти собственника"


 «The Baltic Course» Is Sold and Stays in Business!
