
Analytics, Covid-19, Financial Services, Latvia, Society
International Internet Magazine. Baltic States news & analytics
Monday, 25.05.2026, 12:45
Monthly household consumption expenditure in Latvia reached EUR 423 per person in 2019
 Print version
Highest expenditure recorded in Riga and lowest in rural areas
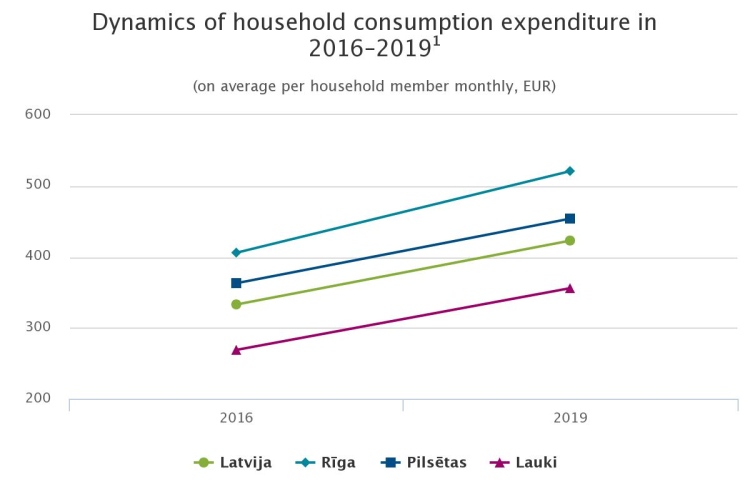
In 2019, the highest expenditure was observed in households located in Riga – EUR 521 on average per household member monthly, whereas the lowest in rural areas where it reached on average EUR 356. In other cities household consumption expenditure exceeded that of rural households by EUR 98 and comprised EUR 454.
Largest share of consumption expenditure spent on food
Almost two thirds (65 %) of the total consumption expenditure went to meet daily needs – pay for food, transport, housing, clothing and footwear, as well as health. Every month EUR 98 or 23 % of the total consumption expenditure was spent on food. Second and third priority was given to housing and transport – 14.6 % on each (EUR 62 on average per household member monthly).
Composition and structure of consumption expenditure in 2019
|
|
Consumption expenditure in 2019 (on average per household member monthly, EUR) |
Structure of consumption expenditure in 2019 (%) |
|
Consumption expenditure,
total |
422.95 |
100 |
|
food and non-alcoholic
beverages |
98.32 |
23.3 |
|
transport |
61.69 |
14.6 |
|
housing, water, electricity,
gas and other fuels |
61.51 |
14.6 |
|
recreation and culture |
34.42 |
8.1 |
|
health |
30.15 |
7.1 |
|
miscellaneous goods and
services |
29.60 |
7.0 |
|
furnishings, household
equipment and routine maintenance of the house |
24.23 |
5.7 |
|
hotels, cafés and
restaurants |
22.92 |
5.4 |
|
clothing and footwear |
22.50 |
5.3 |
|
communication |
20.35 |
4.8 |
|
alcoholic beverages, tobacco |
12.19 |
2.9 |
|
education |
5.07 |
1.2 |
Changes over years
Increase in the consumption expenditure was facilitated by the rise in earnings as well as employment. In 2019, compared to 2016, net wages and salaries went up by 26 % (EUR 162), share of employed population grew by 3.4 percentage points, whereas unemployment dropped by 3.3 percentage points.
Both increase in expenditure and inflation may be observed in all consumption expenditure groups. The sharpest expenditure increase may be observed in:
- furnishings, household equipment and routine
maintenance of the house (of 50 %), mainly household equipment,
- miscellaneous goods and services (of 49 %),
mainly insurance and personal care,
- hotels, cafés and restaurants (of 43 %),
mainly catering services,
- communication (of 41 %), mainly Internet services.
- Analysis of consumption expenditure by household type shows the highest expenditure in households of single men (on average EUR 609 monthly, which is 29 % more than in households of single women – EUR 474 monthly). Consumption expenditure of males and females differ. Compared to women, single men spend 5.2 times more on transport, 3.8 times more on alcoholic beverages and tobacco, and 3.5 more on cafés and restaurants. Single women, in turn, spend 1.7 times more on health. Bearing in mind that income of women in general is lower, single women spend half (50.3 %) of it to meet basic needs, compared to only 37.6 % of income received by males. Females spend 22.6 % on housing (males 17.2 %) and 27.7 % on food (males 20.4 %).
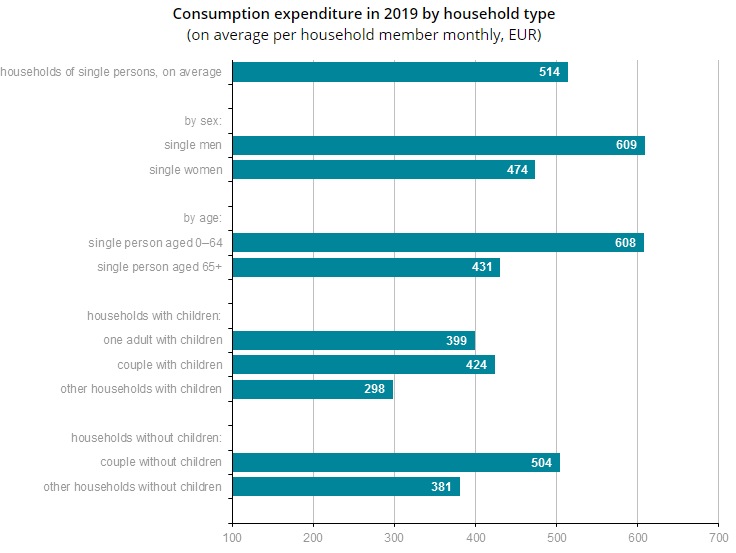
- Higher expenditure may also be observed in households consisting of couples without children – EUR 504 per household member monthly. Couples with children, in turn, on average spend EUR 424 per household member monthly, which meets the national average indicator.
- The lowest consumption expenditure may be observed in other households with children as well as households consisting of one adult with children – EUR 298 and EUR 399 per household member monthly, respectively.
- Highest expenditure observed in households of employers and self-employed persons
- Analysis of household consumption expenditure by socio-economic status of the main breadwinner shows the highest expenditure in households of employers and self-employed persons (EUR 472 on average per household member monthly) and households of wage and salary earners (EUR 446), whereas in households of pensioners those were only EUR 336.
- Richest households spend 2.7 times more on basic needs
- In 2019, richest households (belonging to the 5th quintile group2) were able to spend on average EUR 443 per household member monthly on basic needs like food, housing, transport, clothing and footwear, as well as health, whereas poorest households (belonging to the 1st quintile group) were able to spend only EUR 166 or 2.7 times less. Richest households spend 6 times more on recreation and culture than poorest households (EUR 78 and EUR 14, respectively). Expenditure of the 1st quintile group households constituted half (56 %) of the national average consumption level.
- Richest households on average spent EUR 757 per household member monthly, which is 3.2 times more than poorest households (EUR 236).
- In 2019, Household Budget Survey engaged 2 647 households from the whole Latvia. Each household participating in the survey represented up to 3 200 demographically similar households.
- More information on the results of the Household Budget Survey 2019 will be available in the CSB databases on 30 July.
- Methodological explanations
- 1Due to the changes in questionnaire design and improvements in the calculation methodology results of the Household Budget Survey 2019 are not fully comparable with the results of the surveys conducted prior.
- 2 Quintile groups are formed by arranging all households in ascending sequence by disposable income per one household member and dividing them afterwards in five equal groups.
- 28.01.2022 BONO aims at a billion!
- 25.01.2021 Как банкиры 90-х делили «золотую милю» в Юрмале
- 30.12.2020 Накануне 25-летия Балтийский курс/The Baltic Course уходит с рынка деловых СМИ
- 30.12.2020 On the verge of its 25th anniversary, The Baltic Course leaves business media market
- 30.12.2020 Business Education Plus предлагает анонсы бизнес-обучений в январе-феврале 2021 года
- 30.12.2020 Hotels showing strong interest in providing self-isolation service
- 30.12.2020 EU to buy additional 100 mln doses of coronavirus vaccine
- 30.12.2020 ЕС закупит 100 млн. дополнительных доз вакцины Biontech и Pfizer
- 29.12.2020 В Rietumu и в этот раз создали особые праздничные открытки и календари 2021
- 29.12.2020 Latvia to impose curfew, state of emergency to be extended until February 7


 «The Baltic Course» Is Sold and Stays in Business!
