
Advertising, Analytics, Economics, GDP, Latvia, Statistics
International Internet Magazine. Baltic States news & analytics
Tuesday, 17.03.2026, 00:13
Latvian GDP contracts 1.5% in Q1
 Print version
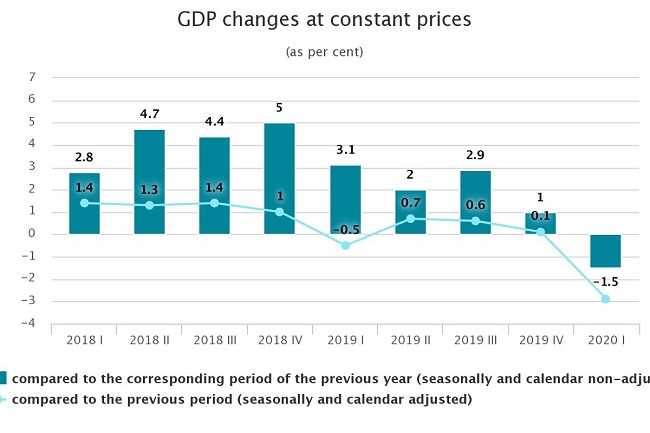
In the 1st quarter of 2020 GDP at current prices comprised EUR 6 750.9 mln
GDP changes in the 1st quarter of 2020 by kind of economic activity
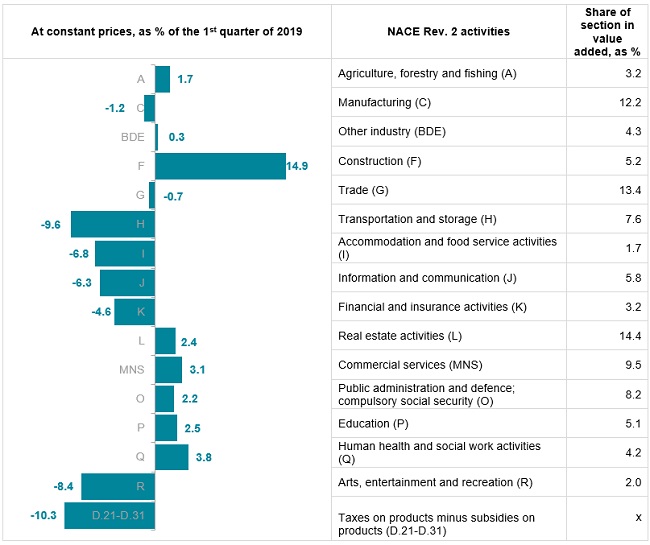
Favourable weather conditions promoted development of mining and quarrying sectors – growth of 8.8% was observed (rise in both sub-sectors in quarrying – of 48.1%, in peat extraction and processing – of 2.8%).In the 1st quarter of 2020 production in agriculture, forestry and fishing growth was estimated at 1.7%.
In the 1st quarter of 2020, compared to the 1st quarter of 2019, manufacturing volume decreased by 1.2% (reduction was observed in 11 out of 22 manufacturing sectors). In the largest manufacturing sector – timber production – fall of 1.9 % was observed. Larger declines were in sectors with smaller share in total value added: repair and installation of machinery and equipment – of 19.3%, manufacture of machinery and equipment n.e.c. – 11.3%, manufacture of wearing apparel – 11.0%. But increase was observed in manufacture of food products (of 2.6%), manufacture of non-metallic mineral products (6.1%), manufacture of fabricated metal products (2.9%), manufacture of computer, electronic and optical products (3.7%).
In electricity, gas, steam and air conditioning supply manufacturing fell by 2.2%. Production and distribution of electricity rose by 1.7%, but in steam and air conditioning supply – by 0.7%. Due to warm weather uncharacteristic to the season, distribution of natural gas fell significantly.
Construction production rose by 14.9%. Building construction increased by 16.4%, civil engineering – by 16.0% (of which, construction of roads and railways – by 25.5% and construction of utility projects – by 6.5%).
Specialized construction activities were carried out more by 9.7%, which was affected by rise of building completion and finishing (of 14.0%) and other specialized construction activities (43.3%), as well as fall of 1.3% in electrical, plumbing and other construction installation activities.
Retail trade increased by 2.6%, of which trade in food products – by 5.7%, but trade in non-food products – by 0.8%. Wholesale trade, retail trade and repair of motor vehicles and motorcycles reduced by 6.3%, but wholesale – by 2.7%.
In transport and storage sector decrease of 9.6% was promoted by drop in volume of provision of services in storage and transport auxiliary services – by 13.4%, in passenger traffic – by 7.9 %, in postal and courier activities by – 9.5%, in freight transport – by 5.5%.
Services provided in accommodation and catering services sectors fell by 6.8%, of which accommodation experienced drop of 13.4%, but catering – of 4.3%.
Services of information and communication sectors reduced by 6.3%, of which of 1.4% in computer programming and consulting, of 4.8% – in information services and of 15.8% – in telecommunication services.
Fall of 4.6% in financial and insurance activities was determined by 9.4% drop in financial service activities and 0.7% decrease in insurance, reinsurance and pension funding. In activities auxiliary to financial services and insurance activities there was an increase of 35.6%. In financial service activities fall was affected by reduction of profit on transactions with financial instruments and decrease of commission income of credit institutions. Reduction in insurance, reinsurance and pension funding sector was affected by increase of retirement capital paid in private pension plans (3rd pillar).
Professional, scientific and technical activities rose by 1.6%, which was affected by increase in activities of head offices; management consultancy activities – by 14.1%, legal and accounting activities – by 2.8%, sectors of R&D – by 2.5%, while architectural and engineering services negatively affected development of the sector where drop of 9.1% was observed.
Administrative and support service activities went up by 7.3%, which was facilitated by the significant rise in rental and leasing services sector (of 18.2%) and growth of 15.8% in labour recruitment and provision of personnel sector. Drop of 8.7% was observed in security and investigation activities. But services provided by travel agency, tour operator reservation service and related activities reduced by 15.7% due to COVID-19 pandemic.
In the 1st quarter of 2020 the volume of taxes on products (value added tax, excise and customs taxes) decreased by 10.0%. That was affected by smaller value added tax revenues, as well as due to the reduction in consumption of oil products, natural gas and alcoholic beverages excise tax revenues declined. Taxes on products were affected negatively by the increase of tax rates on several items.
As compared to GDP flash estimate, value added of sectors rose by 0.8 percentage points, however, the latest information on taxes on products collected has left a negative impact on this increase and reduced total GDP value by 0.1 percentage point.
Expenditure approach
(at constant prices, seasonally and calendar non-adjusted data)
GDP changes in the 1st quarter of 2020 by kind of expenditure
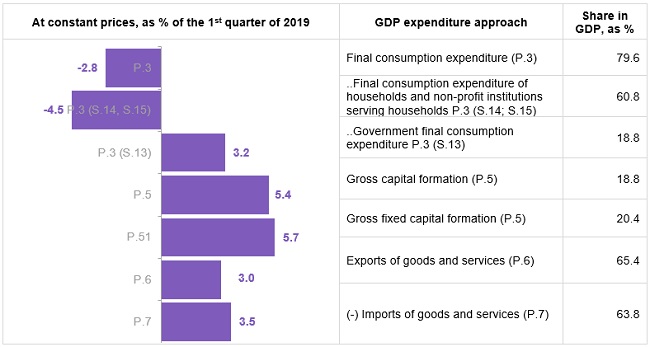
In the 1st quarter of 2020, as compared to the corresponding period of the previous year, household expenses for final consumption reduced by 4.5%. Affected by COVID-19 crisis, expenditure of households have reduced in two out of all main expenditure groups: on transport (public transport, purchase and exploitation of transport vehicles) – by 9.1% and recreation and culture – by 15.3%. Household's expenditure on housing, which is made up by expenditure on rentals for housing, expenditure in maintenance and repair of the dwelling, water supply, electricity, gas and other fuels has remained at the level of the previous year, but household expenditure on food has risen by 1.5%. Groups of these expenditures comprise 64% of the total household expenditure.
Government final consumption expenditure grew by 3.2%.
Investment in gross fixed capital rose by 5.7%. Volume of positive investment was mainly determined by investment in dwellings and other buildings and structures, which rose by 11.4% and comprised 58% of all investments. Investment in machinery and equipment (of which in transport vehicles) reduced by 1.6%, but investment in intellectual property products (research, computer software, databases, copyrights, etc.) – rose by 1.2%.
In the 1st quarter exports of goods and services rose by 3.0%, of which exports of goods (73 % of total exports) – by 7.3%, exports of services – reduced by 7.4%, which was mainly determined by drop of exports of transport services.
Imports of goods and services increased by 3.5%. Imports of goods, which comprises 84% of total imports, has risen by 5.6%, but imports of services – decreased by 6.5%. Drop of imports of services was determined by reduction of imports in several kinds of services, of which in imports of transport and tourism services (52% of total imports of services).
Income approach
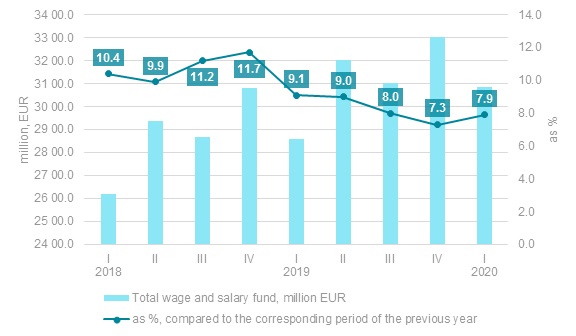
Compared to the 1st quarter of 2019, in the 1st quarter of 2020 compensation of employees at current prices grew by 6.4%, of which total wages and salaries – by 7.9%, but employers' social security contributions – remained at the level of the 1st quarter of 2019.
The sharpest increase in compensation of employees was registered in information and communication – by 13.0% and construction – by 10.4%.
Total wages and salaries and changes
Gross operating surplus and mixed income decreased by 7.0%, whereas the balance of taxes on production and imports and subsidies went down by 8.4%.
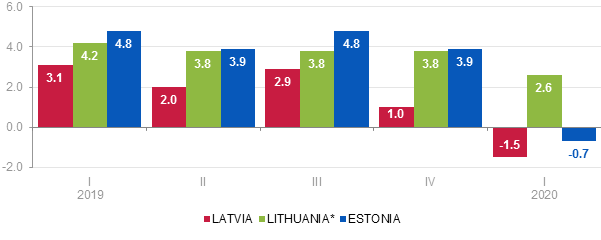
GDP changes in the Baltic countries
(at constant prices, seasonally and calendar non-adjusted, as % of the corresponding period of the previous year)
- 28.01.2022 BONO aims at a billion!
- 25.01.2021 Как банкиры 90-х делили «золотую милю» в Юрмале
- 30.12.2020 Накануне 25-летия Балтийский курс/The Baltic Course уходит с рынка деловых СМИ
- 30.12.2020 On the verge of its 25th anniversary, The Baltic Course leaves business media market
- 30.12.2020 Business Education Plus предлагает анонсы бизнес-обучений в январе-феврале 2021 года
- 30.12.2020 Hotels showing strong interest in providing self-isolation service
- 29.12.2020 В Латвии вводят комендантский час, ЧС продлена до 7 февраля
- 29.12.2020 В Rietumu и в этот раз создали особые праздничные открытки и календари 2021
- 29.12.2020 Latvia to impose curfew, state of emergency to be extended until February 7
- 29.12.2020 18-19 января Наталия Сафонова проводит семинар "Управленческий учет во власти собственника"


 «The Baltic Course» Is Sold and Stays in Business!
