
Analytics, EU – Baltic States, Society, Statistics, Transport
International Internet Magazine. Baltic States news & analytics
Tuesday, 31.03.2026, 02:23
In 2019, population of Latvia dropped by 3.4 thousand people
 Print version
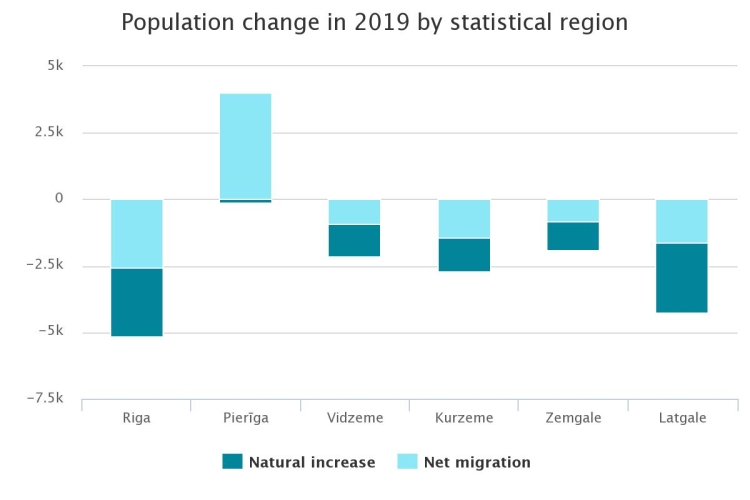
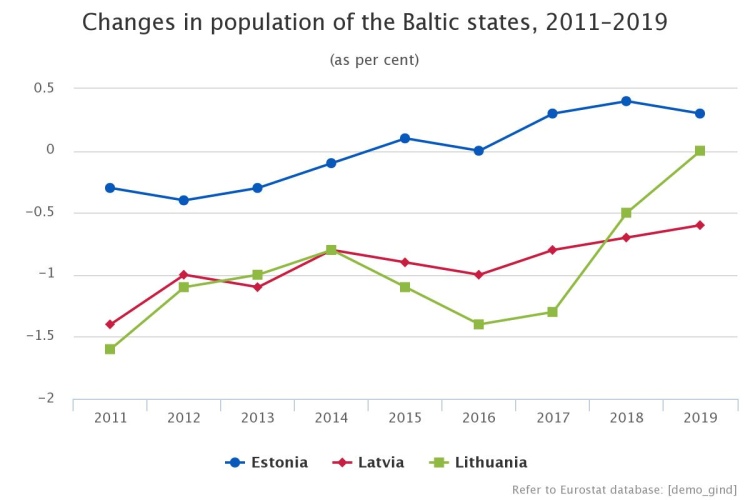
From 2008 to 2016, the number of emigrants was prevailing over that of immigrants, while as emigration reduced the negative natural increase recorded in the past three years exceeded the negative migration flow difference. Over the last three years, the total population of the country has been reducing slower – the decline registered last year accounted for 0.64%, compared to 0.74% in 2018 and 0.81% in 2017.
Last year, 18.8 thousand children were born (528 children fewer than in 2018), whereas 27.7 thousand people passed away (1 101 fewer than the year before). The number of deaths last year was the lowest over the past 47 years – last time the number of deaths was so low (27.3 thousand) in 1972. As the number of deaths declined, the negative natural increase has dropped and comprised 8.9 thousand (9.5 thousand – in 2018).
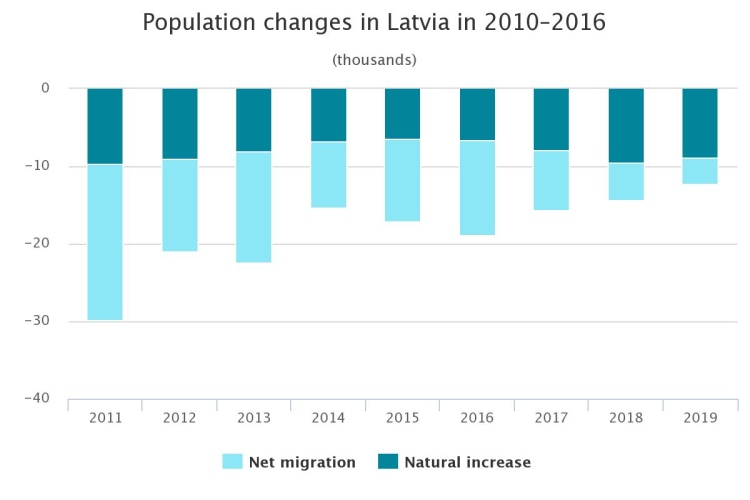
In 2019, 11.2 thousand people arrived in Latvia
from other countries (three hundred more than in 2018), but 14.6 thousand
left the country (1.2 thousand less). Out of the immigrants,
2.5 thousand people or 23% came from the European Union (EU) countries. As
compared to 2018, the number of persons arrived was 10% larger. It must be
noted that in the compilation of statistical data the United Kingdom is not
included in the number of EU countries anymore. In 2019, 2.2 thousand
persons or 19.6% of the total number of immigrants arrived from the United
Kingdom (2.2 thousand – in 2018). The number of immigrants from CIS countries increased slightly –
4.3 thousand or 6% more than in 2018: 1.5 thousand arrived from
Ukraine, 1.1 thousand – from Russia. 830 immigrants arrived from
India last year (938 – in 2018).
In 2019, 5.1 thousand or 46% of immigrants were remigrants – citizens and non-citizens of Latvia, as well as people having other citizenship but who were born in Latvia. People not legally related to Latvia formed the rest part of the immigrants.
Out of the emigrants, 9.2 thousand people emigrated to the EU countries, which was 1.3% more than a year ago. Emigration to the United Kingdom fell by 30% in 2019 – 2.9 thousand emigrated (4.2 thousand – in 2018). One and a half thousand people departed to Germany, 400 – 500 people emigrated to Ireland, Norway and the Netherlands. Emigration to CIS countries also reduced by 23%. Citizens of Latvia constituted 72% of the emigrants (82% – in 2018).
Demography trends in Latvia; 2017–2019
|
|
2017 |
2018 |
2019 |
2018, as% compared to 2017 |
2019, as% compared to 2018 |
per 1 000 |
|
|
2018 |
2019 |
||||||
|
Population, at the end of
the year |
1 934 379 |
1 919 968 |
1 907 675 |
-0.7 |
-0.6 |
x |
x |
|
Marriages |
13 150 |
13 058 |
12 861 |
-0.7 |
-1.5 |
6.8 |
6.7 |
|
Divorces |
5 943 |
5 967 |
5 971 |
+0.4 |
+0.4 |
3.1 |
3.1 |
|
Births |
20 828 |
19 314 |
18 786 |
-7.3 |
-2.7 |
10.0 |
9.8 |
|
Deaths |
28 757 |
28 820 |
27 719 |
+0.2 |
-3.8 |
15.0 |
14.5 |
|
Immigration |
9 916 |
10 909 |
11 223 |
+10.0 |
+2.9 |
5.7 |
5.8 |
|
Emigration |
17 724 |
15 814 |
14 583 |
-10.8 |
-7.8 |
8.2 |
7.6 |
|
Increase in population number |
Decrease in population number |
|||||
|
5.65 – 2.05 |
1.85 – 0.00 |
-0.02 – -0.95 |
-1.05 – -1.50 |
-1.53 – -1.96 |
-2.16 – -2.98 |
-3.05 – -3.50 |
|
Stopiņi Garkalne Babīte Mārupe Saulkrasti Ķekava Carnikava Ādaži |
Ikšķile Sēja Sigulda Limbaži Aknīste Engure Olaine Ozolnieki Salaspils Vecpiebalga Līgatne Ropaži Inčukalns |
Brocēni Ogre Skrīveri Iecava Amata Rauna Aizkraukle Smiltene Pāvilosta Lielvārde Cēsis Grobiņa Mālpils Priekuļi Beverīna Krustpils Kocēni Tukums Ventspils Durbe |
Krimulda Salacgrīva Talsi Tērvete Valka Dobele Ķegums Jelgava Līvāni Kuldīga Pārgauja Kandava Priekule Rundāle Baldone Bauska |
Gulbene Naukšēni Jaunjelgava Burtnieki Kārsava Alsunga Aizpute Nīca Baltinava Jaunpils Vārkava Madona Roja Mazsalaca Alūksne Koknese Vecumnieki Jaunpiebalga Rucava Viesīte Rūjiena Saldus Viļāni Dundaga Preiļi Pļaviņas |
Varakļāni Balvi Vaiņode Mērsrags Rugāji Ludza Rēzekne Ape Auce Riebiņi Daugavpils Skrunda Strenči Viļaka Krāslava Zilupe Nereta Aglona Ērgļi Sala Aloja |
Cibla Ilūkste Cesvaine Jēkabpils Dagda Lubāna |
For comparison, here is some vital statistics for the Baltic states: at the beginning of 2020 population of Estonia accounted for 1 million 329 thousand people (rise of 4.2 thousand, compared to 2019). Natural increase in Estonia was negative as well – 1.3 thousand, while international long-term net migration was positive – 5.5 thousand.2
Provisional population of Lithuania accounted for 2 million 794 thousand at the beginning of 2020 (increase of the population number – 0.1 thousand). In Lithuania natural increase was negative as well – 10.7 thousand, while international long-term net migration was positive – 10.8 thousand.3
Annual population estimate was drawn up based on the data of the Population Register of the Office of Citizenship and Migration Affairs and other administrative data sources. As e-services and eGovernment in public institutions increased, use of administrative data provides opportunity to gain objective and reliable information not only on population number and demographic composition, but also on other Population and Housing Census indicators.
Precisely after a year – on 28 May 2021 results of the Census 2021 will be published, which will be compiled from administrative data sources available in Latvia. Until that it is planned to start publishing data on several Population and Housing Census indicators – in summer 2020 on composition of family, but in autumn on education acquired by population.
Information on population number in administrative territories at the beginning of 2020, as well as data on key demographic indicators are available in the CSB database section „Population”.
Methodological explanations
Natural increase – the difference between the number of births and the number of deaths in a given period.
Net migration – difference between the total number of persons arriving in the country for usual residence for at least one year and total number of persons departing from it for usual residence or for at least one year.
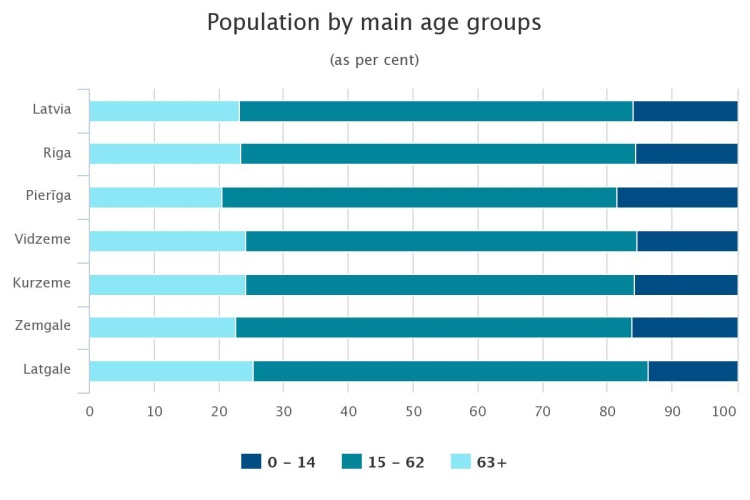
1 Usually resident population in main age groups is calculated based on the age in full years in line with the working and retirement age set by the Latvian legislation. At the beginning of 2020, working age constituted 15–62 years (incl.) and retirement age – 63 years and over.
2 Press release published on Statistics Estonia website on 12 May https://www.stat.ee/news-release-2020-059
3 Statistics Lithuania website https://osp.stat.gov.lt
- 26.08.2021 LLC Dizozols Investments finalizes investment attraction deal with Crowdestor with record-high profits
- 30.12.2020 Hotels showing strong interest in providing self-isolation service
- 30.12.2020 EU to buy additional 100 mln doses of coronavirus vaccine
- 30.12.2020 ЕС закупит 100 млн. дополнительных доз вакцины Biontech и Pfizer
- 29.12.2020 В Латвии вводят комендантский час, ЧС продлена до 7 февраля
- 29.12.2020 Latvia to impose curfew, state of emergency to be extended until February 7
- 29.12.2020 Linde Gas открывает завод в Кедайняйской СЭЗ
- 29.12.2020 Президент Литвы утвердил бюджет 2021 года
- 29.12.2020 В Риге можно изолироваться в трех гостиницах
- 28.12.2020 Tartu to support students' solar car project


 «The Baltic Course» Is Sold and Stays in Business!
