
Analytics, Energy, Industry, Lithuania, Markets and Companies
International Internet Magazine. Baltic States news & analytics
Thursday, 19.03.2026, 14:50
In April prices for the industrial production in Lithuania decreased by 5.3%
 Print version
Over the month, prices for industrial production sold on the Lithuanian market decreased by 3.6%, refined petroleum products excluded – by 1.2%. The largest decrease in prices was observed for the products of extraction of crude petroleum (33%), increase – computer, electronic and optical products (2.9%). Food products went up in price by 0.1%. A significant increase in prices was recorded for fruit, berry and vegetable juice – 12.8, processed and preserved fruit and vegetables – 12, processed tea and coffee – 4.6, prepared meals and dishes – 4.4%, while decrease was observed for prepared food for pets – 7.5, cocoa, chocolate and sugar confectionery – 3, prepared animal feeds for farm animals – 1.3%.
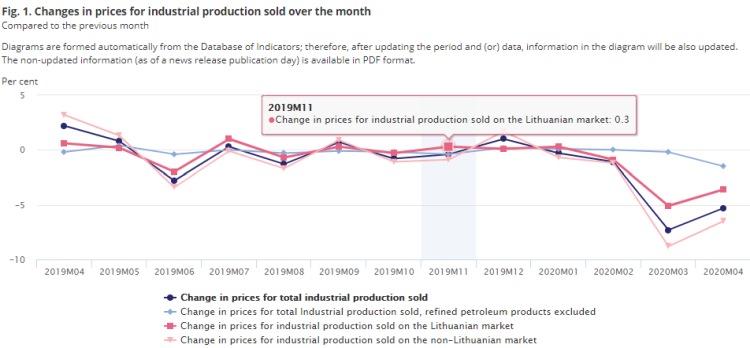
Over the month, prices for industrial production sold on the non-Lithuanian market decreased by 6.5%, refined petroleum products excluded – by 1.8%. Over the month, prices for industrial production sold on the euro area market decreased by 7%, on the non-euro area market – 6.3%.'
Over the year (April 2020, against April 2019), prices for the total industrial production sold decreased by 15.5%, refined petroleum products excluded – 2.4%.
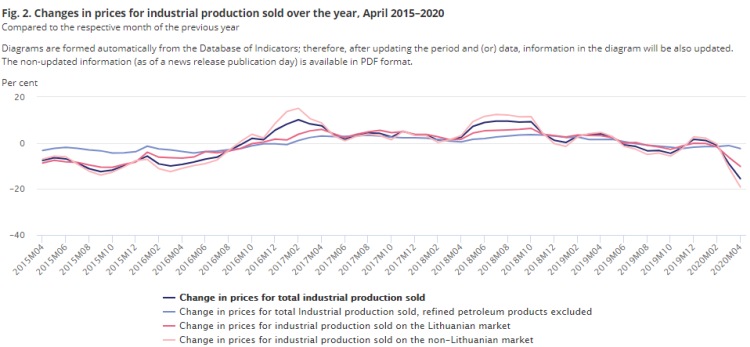
Over the year, prices for industrial production sold on the Lithuanian market decreased by 10.2%, refined petroleum products excluded – 1.3%.
Over the year, prices for industrial production sold on the non-Lithuanian market decreased by 19.1%, refined petroleum products excluded – 3.1%.
Over the year, prices for industrial production sold on the euro area market decreased by 16.6%, on the non-euro area market – 20.7%.
Changes in prices for industrial production sold, April 2020, %
|
Economic activity |
Relative share (weight) in total industrial production |
Price growth, drop (–) |
||
|
March 2020 |
2019 |
|||
|
December |
April |
|||
|
Total industrial production sold |
100.0 |
–5.3 |
–13.4 |
–15.5 |
|
Mining and quarrying |
0.9 |
–5.2 |
–3.3 |
–3.2 |
|
Manufacturing |
92.0 |
–5.5 |
–14.6 |
–16.7 |
|
Manufacture of refined petroleum products |
21.3 |
–28.6 |
–57.0 |
–60.5 |
|
Electricity, gas, steam and air conditioning supply |
6.4 |
–3.4 |
0.5 |
–2.0 |
|
Water supply; sewerage, waste management and remediation activities |
0.7 |
–2.6 |
0.0 |
–0.1 |
|
Total industrial production, refined petroleum products excluded |
78.7 |
–1.5 |
–1.6 |
–2.4 |
|
Manufacturing production, refined petroleum products excluded |
70.7 |
–1.3 |
–1.8 |
–2.4 |
|
Total industrial production sold on the Lithuanian market |
100.0 |
–3.6 |
–9.1 |
–10.2 |
|
Mining and quarrying |
1.6 |
–2.1 |
–0.6 |
0.5 |
|
Manufacturing |
81.8 |
–3.8 |
–11.3 |
–12.1 |
|
Manufacture of refined petroleum products |
15.5 |
–26.2 |
–55.9 |
–57.3 |
|
Electricity, gas, steam and air conditioning supply |
15.5 |
–3.4 |
0.5 |
–2.0 |
|
Water supply; sewerage, waste management and remediation activities |
1.1 |
–1.4 |
2.0 |
1.3 |
|
Total industrial production sold on the Lithuanian market, refined
petroleum products excluded |
84.5 |
–1.2 |
–0.5 |
–1.3 |
|
Manufacturing production, refined petroleum products excluded |
66.3 |
–0.6 |
–0.8 |
–1.2 |
|
Total industrial production sold on the non-Lithuanian market |
100.0 |
–6.5 |
–16.4 |
–19.1 |
|
Mining and quarrying |
0.5 |
–11.6 |
–9.1 |
–11.0 |
|
Manufacturing |
99.1 |
–6.5 |
–16.5 |
–19.2 |
|
Manufacture of refined petroleum products |
25.3 |
–29.6 |
–57.5 |
–61.6 |
|
Electricity, gas, steam and air conditioning supply |
- |
- |
- |
- |
|
Water supply; sewerage, waste management and remediation activities |
0.4 |
–4.8 |
–3.6 |
–2.1 |
|
Total industrial production sold on the non-Lithuanian market, refined
petroleum products excluded |
74.7 |
–1.8 |
–2.5 |
–3.1 |
|
Manufacturing production, refined petroleum products excluded |
73.8 |
–1.7 |
–2.4 |
–3.1 |
|
Total industrial production sold on the euro area market |
100.0 |
–7.0 |
–15.7 |
–16.6 |
|
Total industrial production sold on the non-euro area market |
100.0 |
–6.3 |
–16.8 |
–20.7 |
_______________________
- Such a phenomenon (indicator) was not observed
during the respective period.
More detailed information on the greatest influence on the change in prices for industrial production sold by economic activity is provided in the Table Influence on the monthly change in prices for industrial production sold (XLSX). A press release on the May 2020 PPI is due on 9 June 2020.
For more information, please see the Database of Indicators. Statistical information is produced and disseminated pursuant to the European Statistics Code of Practice.
- 28.01.2022 BONO aims at a billion!
- 30.12.2020 Накануне 25-летия Балтийский курс/The Baltic Course уходит с рынка деловых СМИ
- 30.12.2020 On the verge of its 25th anniversary, The Baltic Course leaves business media market
- 30.12.2020 EU to buy additional 100 mln doses of coronavirus vaccine
- 30.12.2020 ЕС закупит 100 млн. дополнительных доз вакцины Biontech и Pfizer
- 29.12.2020 В Латвии вводят комендантский час, ЧС продлена до 7 февраля
- 29.12.2020 Latvia to impose curfew, state of emergency to be extended until February 7
- 29.12.2020 Linde Gas открывает завод в Кедайняйской СЭЗ
- 29.12.2020 Number of new companies registered in Estonia up in 2020
- 29.12.2020 Президент Литвы утвердил бюджет 2021 года


 «The Baltic Course» Is Sold and Stays in Business!
