
Analytics, Covid-19, Inflation, Latvia, Markets and Companies
International Internet Magazine. Baltic States news & analytics
Sunday, 05.04.2026, 12:40
Annual inflation in April made 0% in Latvia
 Print version
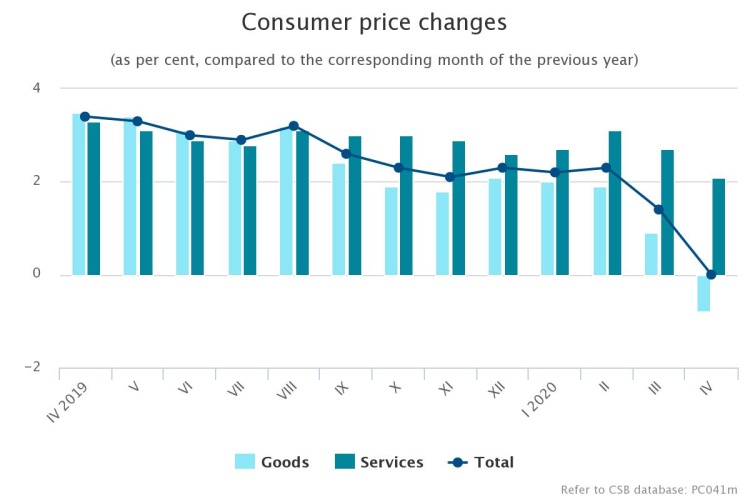
Over the year, prices within the group of food and non-alcoholic beverages increased by 3.6 %. Prices of dried, salted or smoked meat (up by 11.7 %), pork (11.9 %), meat products (9.2 %) and poultry (2.8 %) had the most significant upward impact on the average price level within the group. Upturn was registered also in prices of fresh fruit (of 18.3 %), mainly lemons and oranges.
Increase was recorded in prices of bakery products (of 3.2 %), buckwheat (21.3 %), sugar (6.8%), fresh or chilled fish (8.9 %), dried, other preserved or processed vegetables (7.6 %), vegetable oil (5.9 %), pasta products (5.6 %). Decline, in turn, was registered in prices of potatoes (of 16.8 %), coffee (4.6 %), eggs (4.3 %), milk (3.4 %), milk products (1.7 %), and olive oil (10.0 %).
The average level of alcoholic beverage and tobacco product prices went up by 1.5 %. Prices of alcoholic beverages grew by 0.1 %, which was mainly due to the rise in prices of beer and wine. Prices of tobacco products grew on average by 3.9 %.
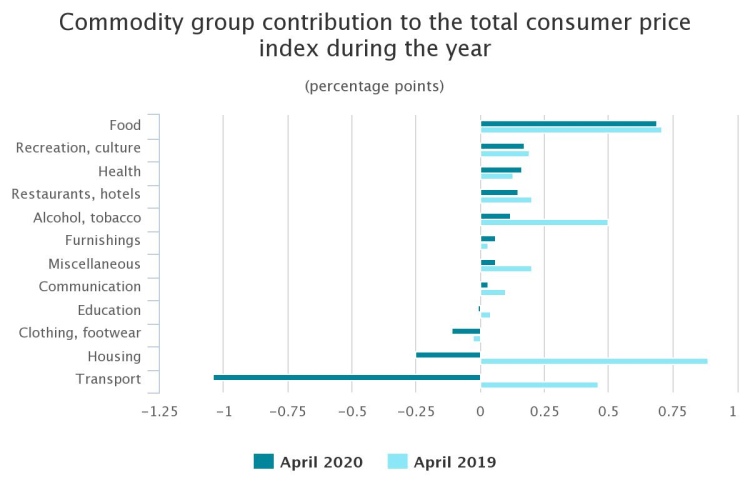
Over the year, prices of goods and services related to housing dropped on average by 1.5 %. Decline was recorded in prices of natural gas, electricity, solid fuels, rentals for housing, while increase was registered in maintenance charges in multi-occupied buildings, prices of refuse collection, materials for the maintenance and repairs of the dwelling, as well as services for the maintenance and repairs of the dwelling.
Within the health care group, the average level of prices rose by 2.8 %, which was mainly influenced by the increase in prices in general medical practice, prices of dental services, as well as prices in medical specialist practice. Upturn was also registered in prices of pharmaceutical products.
Prices of goods and services related to transport declined by 7.5 %, which was affected by the drop in prices of fuels for transport (of 20.0 %), mainly diesel (of 21.9 %), petrol (18.4 %), and auto gas (14.5 %). The average level of second-hand motor car prices reduced. Increase over the year was observed in prices of passenger transport by road, maintenance and repair of personal transport equipment, as well as passenger transport by train.
Prices of goods and services related to recreation and culture grew by 2.0 %. Over the year, increase was registered in the average level of pet food, newspaper and magazine, television subscription fee, as well as toy prices. The average level of book prices reduced.
The average level of restaurant and hotel service prices went up by 2.9 %. Price rise was mainly affected by catering services, as the average level of restaurant and café service prices increased by 3.7 % and that of canteen services by 4.0 %.
The most significant upturns among other commodity groups were recorded in prices of articles for personal hygiene and beauty products, prices in hairdressing salons and of personal grooming establishment services, as well as prices of telecommunication services. Downturns, in turn, were registered in prices of footwear and motor vehicle insurance
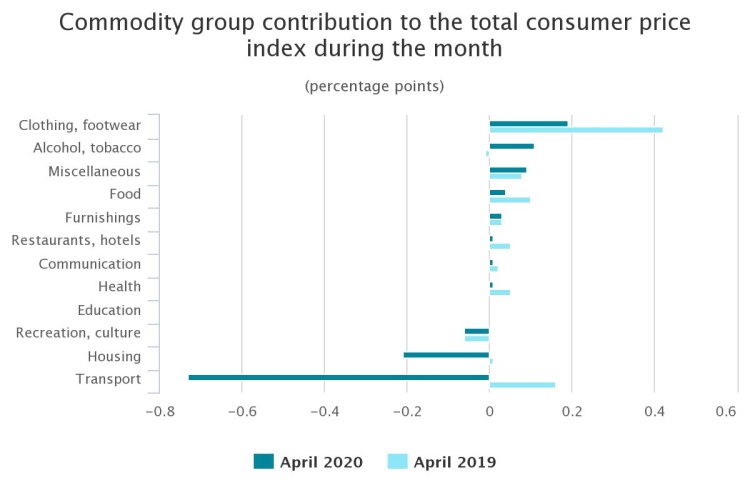
Commodity group | Price changes in April 2020, compared to: | ||
April 2019 | December 2019 | March 2020 | |
Total | 0.0 | 0.3 | -0.5 |
food | 3.2 | 2.9 | 0.2 |
alcohol, tobacco | 1.5 | 2.8 | 1.4 |
clothing, footwear | -1.8 | 5.0 | 3.4 |
housing | -1.5 | -1.7 | -1.3 |
furnishings | 1.5 | 1.2 | 0.8 |
health | 2.8 | 1.9 | 0.1 |
transport | -7.5 | -7.7 | -5.4 |
communication | 0.9 | 1.3 | 0.3 |
recreation, culture | 2.0 | 1.1 | 0.7 |
education | -0.5 | 0.1 | 0.0 |
restaurants, hotels | 2.9 | 1.4 | 0.3 |
miscellaneous | 1.1 | 2.6 | 1.6 |
During the month, the average level of consumer prices fell by 0.5 %.
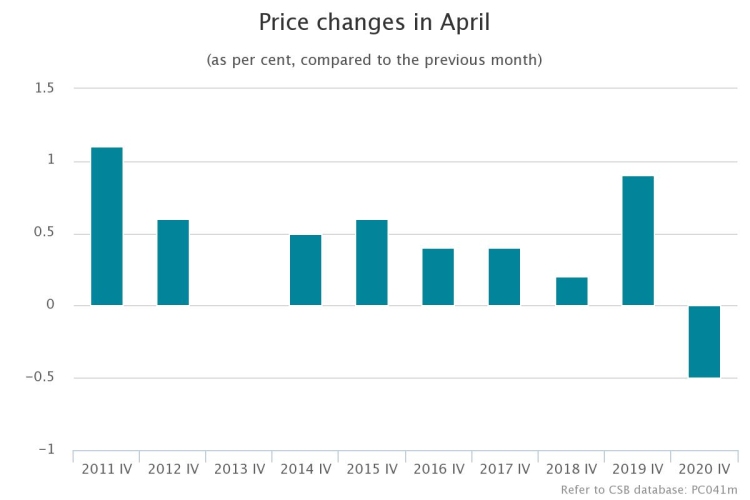
Compared to March 2020, in April 2020 the average level of consumer prices reduced by 0.5 %. Prices of goods fell by 0.7 % and prices of services by 0.2 %. The greatest pressure on the price changes was put by the drop in prices of goods and services related to transport, goods and services related to housing, goods and services related to recreation and culture, as well as increase in prices of clothing and footwear, alcoholic beverages and tobacco products, prices in miscellaneous goods and services group, as well as prices of food and non-alcoholic beverages.
Over the month, prices of food and non-alcoholic beverages grew by 0.2 %. Prices of fresh vegetables (rise of 4.3 %) and fresh fruit (4.0 %) had the strongest upward influence on the average price level within the group. Increase was also recorded in prices of yoghurt (of 3.3 %), pasta products (4.9 %), ice cream (2.9 %), and buckwheat (7.5 %). Decline, in turn, was registered in prices of bread (of 2.6 %), eggs (6.7 %), poultry (1.8 %), bakery products (1.1 %), coffee (1.3 %), chocolate (2.1 %), and butter (2.9 %).
The average level of alcoholic beverage and tobacco product prices grew by 1.4 %, which was mainly influenced by the rise in spirit, beer, and wine prices. The upturn started with the excise duty increase last month.
The average level of prices within clothing and footwear group went up by 3.4 %. Price rise mainly was influenced by the increase in footwear prices (of 8.8 %). Garment prices grew on average by 1.8 %.
Prices of goods and services related to housing dropped by 1.3 %. Downturn was registered in prices of heat energy (of 3.1 %) and rentals for housing (7.1 %). Upturn was recorded in prices of materials for the maintenance and repair of the dwelling (of 1.7 %).
Prices of goods and services related to transport fell on average by 5.4 %. Prices of fuels for transport reduced by 14.2 %, of which prices of diesel by 14.3 %, of petrol by 14.6 %, and of auto gas by 11.4 %. Decline in prices of fuels for transport was significantly influenced by the situation on the global oil market which was affected by the worldwide COVID-19 crisis.
Prices of goods and services related to recreation and culture reduced by 0.7 %. Downturn was observed in the average level of flower prices, as well as prices of pet food and fiction books.
Within the miscellaneous goods and services group, prices rose on average by 1.6 %, which was affected by the end of discounts on articles for personal hygiene and beauty products.
Among other commodity groups, the most notable decline was registered in prices of glasses and contact lenses, while increase was recorded in the average level of household cleaning and maintenance product prices.
COVID-19 influence on consumer price index in April
Data collection
The consumer price survey is conducted in Riga and ten other cities and towns from 4th to 20th date. Price collection is performed by trained CSB employees by visiting sampled trade and services outlets, collecting prices online, or conducting telephone interviews.
Due to the restrictions introduced due to the COVID-19 and aiming to ensure safety of the price collectors, the share of prices collected remotely (using Internet resources and telephone interviews) was increased in April.
In April approximately 16 % of prices were collected with one of the alternative price collection options (the share represents only the prices usually collected by visiting registration places).
Data quality
Consumer price index calculations each month are based on approximately 25 thousand prices. All price data collected in April, including prices collected remotely, underwent standard validation procedures. No atypical or unjustified decreases or increases that could be explained by global and seasonal trends were observed. At the end of the data validation, there was no evidence that use of the alternative methods had affected dynamics of price changes or quality of the data. Thus, all price data collected within the survey meet methodology and quality requirements.
Prices that were not available due to the COVID-19 crisis were imputed. Sub-indices quality whereof was influenced significantly are listed in the imputations section. Indices with significant number of imputations (> 50%) caused by COVID-19 and thus having lower quality in the CSB database are indicated with "u".
The share of imputations may differ notably depending on the commodity group, however the share of COVID-19-caused imputations in the total data on April accounts for 6.7 %.
Sample and weights
In line with the consumer price index calculation methodology, weight structure and sample shall be constant throughout the whole year. Therefore, irrespective of the zero activity or significant activity decline in selected sectors, no changes were made in the weights or sample.
Imputations in the calculations caused by the COVID-19 crisis
In April, in all commodity groups, except for the communications, there were prices not observed due to the COVID-19 crisis. The missing prices were imputed using one of the four methods:
- Imputation based on available prices for the same product;
- The last observed price was used (carry forward);
- Imputation of the monthly price change of the corresponding month of the previous year;
- Imputation with the annual rate of change of all reliable price indices.
The first imputation method was used in cases when under the influence of COVID-19 crisis product or service was only partially available, i.e., not in all sampled trade and services outlets, but still was available in sufficient quantity to represent the general price movement.
The second method was used in cases when prices of a good or service are stable, are changing rarely or mostly at the beginning of the year, are fully or partially administered, and there is a reason to believe that after lifting restrictions the good or service will be available for the same price.
The third method was used for services subjected to seasonal price fluctuations.
The fourth method was used in sectors characteristic with zero activity and pronounced seasonal pattern, such as passenger transport by air, passenger transport by sea, package holidays. Annual consumer price index calculation of all reliable indices is based on sub-class level. The sub-class index is considered reliable if number of COVID-19 imputations is under 50 %.
In April 2020, annual consumer price index of all reliable indices constituted 99.9.
The following sub-classes were excluded from the calculations of all reliable CPI (number of imputations exceeded 50 %):
- Medical specialist practice (imputation method 2),
- Services of medical analysis laboratories and x-ray centres (method 2),
- Services of paramedical personnel (method 2),
- Passenger transport by air (method 4),
- Passenger transport by sea (method 4),
- Recreational and sporting services – participation (method 2),
- Cinema and theatre services (method 2),
- Museum services (method 2),
- Games of chance (method 2),
- Package holidays (method 4),
- Training courses (method 2),
- Canteen services (method 2),
- Hotel services (method 1),
- Administrative fees (method 2).
Share of imputations made and imputation methods used in April 2020 by commodity group
Commodity group | Share of imputations, % | Imputation method |
Food | 0.1 | 1 |
Alcohol, tobacco | 0.5 | 1 |
Clothing, footwear | 7.9 | 1 |
Housing | 1.6 | 1 |
Furnishings | 1.9 | 1 |
Health | 14.5 | 1, 2, 3 |
Transport | 13.1 | 1, 2, 3, 4 |
Communication | 0.0 | … |
Recreation, culture | 16.7 | 1, 2, 4 |
Education | 16.0 | 1.2 |
Restaurants, hotels | 44.0 | 1.2 |
Miscellaneous | 4.8 | 1.2 |
Information on consumer price index changes in May 2020 will be published on 8 June.
* The annual inflation reflects consumer price changes, comparing the average price level in the comparison month with the average price level in the corresponding month of the previous year.
- 28.01.2022 BONO aims at a billion!
- 25.01.2021 Как банкиры 90-х делили «золотую милю» в Юрмале
- 30.12.2020 Накануне 25-летия Балтийский курс/The Baltic Course уходит с рынка деловых СМИ
- 30.12.2020 On the verge of its 25th anniversary, The Baltic Course leaves business media market
- 30.12.2020 Business Education Plus предлагает анонсы бизнес-обучений в январе-феврале 2021 года
- 30.12.2020 Hotels showing strong interest in providing self-isolation service
- 30.12.2020 EU to buy additional 100 mln doses of coronavirus vaccine
- 30.12.2020 ЕС закупит 100 млн. дополнительных доз вакцины Biontech и Pfizer
- 29.12.2020 В Rietumu и в этот раз создали особые праздничные открытки и календари 2021
- 29.12.2020 Latvia to impose curfew, state of emergency to be extended until February 7


 «The Baltic Course» Is Sold and Stays in Business!
