
Analytics, Foreign trade , Latvia, Statistics
International Internet Magazine. Baltic States news & analytics
Sunday, 15.03.2026, 13:08
In December foreign trade turnover of Latvia was 8.2% larger than a year ago
 Print version
In
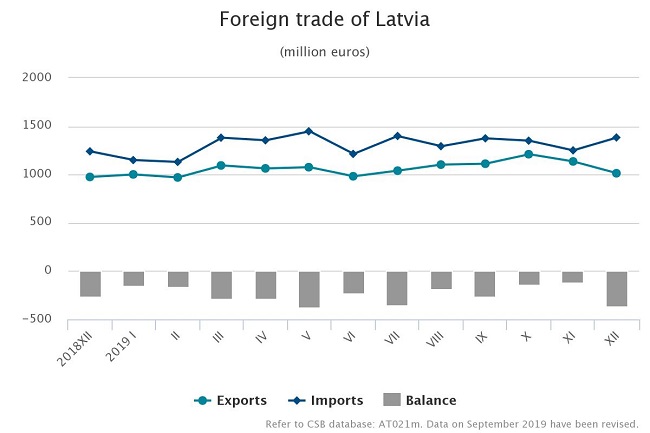
December, Latvia exported goods in the amount of EUR 1.01 bn, but
imported in the amount of EUR 1.38 bn. Compared to
December 2018, foreign trade balance has worsened as exports in total
foreign trade amount decreased from 44% to 42.3%.
In 2019,
the foreign trade turnover of Latvia at current prices reached
EUR 28.52 bn – EUR 14.7 mln or 0.1% less than in 2018. The
exports value constituted EUR 12.8 bn (an increase of
EUR 52 mln or 0.4%), whereas the imports value – EUR 15.73 bn
(a drop of EUR 66.7 mln or 0.4%).
.
Calendar
and seasonally adjusted data show that, compared to December 2018, in
December 2019 the exports value at current prices went up by 2.7% and the
imports value by 7.4%, whereas, compared to the previous month, the exports
value went up by 4.1% and the imports value – by 11.6%.
Main
changes in exports in December 2019, compared to December 2018:
- exports of vegetable products up by EUR 31 mln or 43.3%,
- exports of prepared foodstuffs up by EUR 21 mln or 22%,
- exports of machinery and mechanical appliances;
electrical equipment up by EUR 10.1 mln or 5.9%,
- exports of wood and articles of wood down by
EUR 19.2 mln or 11.2%,
- exports of mineral products down by EUR 10.4 mln or
18.5%.
Main
changes in imports in December 2019, compared to December 2018:
- imports of vehicles and associated transport equipment up by
EUR 124.1 mln or 70.7%,
- imports of machinery and mechanical appliances;
electrical equipment up by EUR 15.2 mln or 5.6%,
- imports of prepared foodstuffs up by EUR 10.9 mln or 10.5%,
- imports of basic metals and articles of basic metals down by
EUR 21.9 mln or 21.6%,
- imports of mineral products down by EUR 10.6 mln or
10.7%.
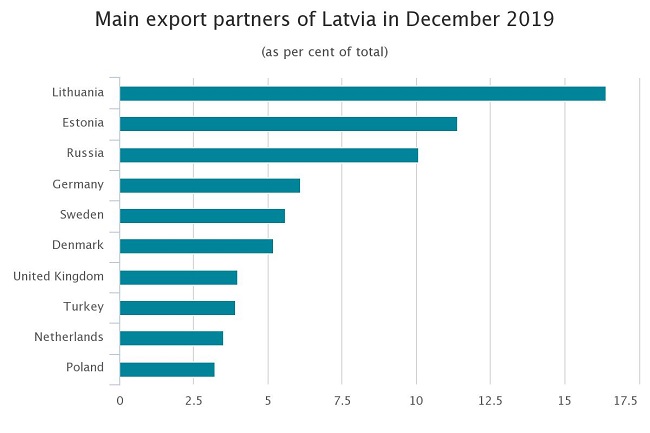
In
December, the main export partners of Latvia in trade with EU countries were
Lithuania (16.4% of total exports), Estonia (11.4%), Germany (6.1%) and Sweden
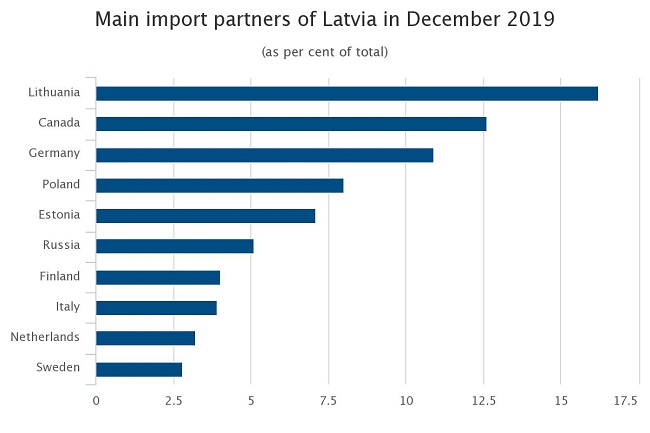
(5.6%), whereas the main import partners were Lithuania (16.2% of total
imports), Germany (10.9%), Poland (8%) and Estonia (7.1%).
In exports
Russia was the main partner in trade with third countries; its share in total
Latvian exports in December accounted for 10.1%, whereas Canada was the main
partner in imports – 12.6% of total imports.
In December 2019,
compared to December 2018, share of the European Union countries in total
exports value fell by 3.7 percentage points and in imports value – by
1.2 percentage points. Rise in share of CIS countries comprised
0.7 percentage points in exports and drop of 3.7 percentage points in
imports.
Foreign
trade of Latvia by country group in December 2019
(at current prices)
|
|
Exports |
Imports |
||||
|
|
mln EUR |
% of total |
changes
as %, compared to December 2018 |
mln EUR |
% of total |
changes
as %, compared to December 2018 |
|
Total |
1 013.0 |
100 |
3.9 |
1 383.4 |
100 |
11.6 |
|
European Union countries |
682.5 |
67.4 |
-1.5 |
993.1 |
71.8 |
9.7 |
|
euro area countries |
476.9 |
47.1 |
3.1 |
737.9 |
53.3 |
10.2 |
|
CIS countries |
155.8 |
15.4 |
8.7 |
109.2 |
7.9 |
-23.8 |
|
other countries |
174.7 |
17.2 |
26.0 |
281.1 |
20.3 |
46.5 |
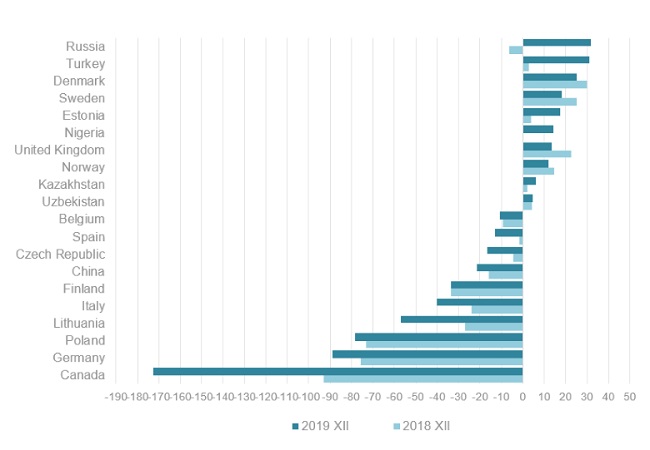
In December 2019 foreign trade balance of Latvia was positive with 122 partner countries, as exports value of goods exceeded imports value of goods. It was negative in trade with 46 countries.
Balance of foreign trade of Latvia
(difference between value of goods exports and imports, mln euros)
The rise in
the exports of cereals in December 2019, as compared to December 2018,
was facilitated by an increase in the exports of wheat and meslin by
EUR 28.3 mln or 2.4 times. In turn, reduction in exports of
mineral fuels, mineral oils and products of their distillation was mostly
influenced by decrease of exports of electricity by EUR 7.9 mln or
45.5%.
Main
commodities in exports of Latvia in December 2019
(at current prices)
|
|
thousand EUR |
as %
of total |
Changes
as %, compared to |
||
|
December 2018 |
November 2019 |
average
of previous 12 months |
|||
|
Total |
1 012 971 |
100 |
3.9 |
-10.8 |
-4.7 |
|
151 872 |
15.0 |
-11.3 |
-10.9 |
-17.9 |
|
|
108 070 |
10.7 |
-2.9 |
-15.0 |
-3.9 |
|
|
72 203 |
7.1 |
22.7 |
9.0 |
16.5 |
|
|
62 370 |
6.2 |
14.8 |
-23.5 |
14.2 |
|
|
60 118 |
5.9 |
96.6 |
68.4 |
47.6 |
|
|
vehicles
other than railway or tramway rolling stock, and parts and accessories
thereof |
42 706 |
4.2 |
-12.0 |
-20.3 |
-26.9 |
|
mineral
fuels, mineral oils and products of their distillation |
41 703 |
4.1 |
-19.6 |
-6.1 |
-15.9 |
|
35 920 |
3.5 |
-17.5 |
-9.1 |
-11.7 |
|
|
furniture,
other furnishing articles; prefabricated buildings |
32 240 |
3.2 |
35.6 |
-15.3 |
2.2 |
|
26 136 |
2.6 |
-5.5 |
-32.1 |
-29.5 |
|
Rise of
imports in commodity group “aircraft, spacecraft, and parts thereof” in
December 2019, compared to December 2018, was affected by purchase of
aircrafts – increase of EUR 113.4 mln. In turn, decline in imports of
iron and steel by EUR 15.1 mln or by 45.8% significantly influenced
drop in imports of flat-rolled products of iron or non-alloy steel.
Main
commodities in imports of Latvia in December 2019
(at current prices)
|
|
thousand EUR |
as %
of total |
Changes
as %, compared to |
||
|
December 2018 |
November 2019 |
average
of previous 12 months |
|||
|
Total |
1 383 389 |
100 |
11.6 |
10.7 |
6.5 |
|
189 806 |
13.7 |
2.8 times |
15.2 times |
4.5 times |
|
|
149 729 |
10.8 |
19.4 |
-8.6 |
9.8 |
|
|
135 698 |
9.8 |
-8.7 |
17.6 |
7.5 |
|
|
vehicles other than railway or tramway rolling stock, and
parts and accessories thereof |
107 171 |
7.7 |
1.5 |
10.2 |
-1.6 |
|
mineral fuels, mineral oils and products of their
distillation |
85 300 |
6.2 |
-9.8 |
-8.0 |
-27.2 |
|
49 700 |
3.6 |
3.5 |
-2.8 |
-6.7 |
|
|
45 066 |
3.3 |
4.6 |
-8.6 |
-7.7 |
|
|
43 617 |
3.2 |
6.4 |
-8.7 |
-17.7 |
|
|
43 129 |
3.1 |
3.3 |
-10.4 |
-9.6 |
|
|
33 435 |
2.4 |
-37.0 |
-16.1 |
-28.4 |
|
- 28.01.2022 BONO aims at a billion!
- 25.01.2021 Как банкиры 90-х делили «золотую милю» в Юрмале
- 30.12.2020 Накануне 25-летия Балтийский курс/The Baltic Course уходит с рынка деловых СМИ
- 30.12.2020 On the verge of its 25th anniversary, The Baltic Course leaves business media market
- 30.12.2020 Business Education Plus предлагает анонсы бизнес-обучений в январе-феврале 2021 года
- 30.12.2020 Hotels showing strong interest in providing self-isolation service
- 29.12.2020 В Латвии вводят комендантский час, ЧС продлена до 7 февраля
- 29.12.2020 В Rietumu и в этот раз создали особые праздничные открытки и календари 2021
- 29.12.2020 Latvia to impose curfew, state of emergency to be extended until February 7
- 29.12.2020 18-19 января Наталия Сафонова проводит семинар "Управленческий учет во власти собственника"


 «The Baltic Course» Is Sold and Stays in Business!
