
Alcohol, Analytics, Health, Legislation, Lithuania, Markets and Companies, Medicine
International Internet Magazine. Baltic States news & analytics
Friday, 26.04.2024, 14:52
In 2017, retail prices of alcoholic beverages grew by 11.7% in Lithuania
 Print version
In 2017, country’s retail trade and catering enterprises sold 3.1 million dekalitres of spirits (vodka, whisky, brandy and the like), which is by 358 thousand dekalitres (10.5%) less than in 2016, and 4.2 million dekalitres of wine and fermented beverages, which is by 947 thousand dekalitres (18.4%) less than in 2016. Just as every year, the bulk of sales fell within beer – 23.2 million dekalitres, or by 2.1 million dekalitres (8.2%) less than in 2016.
Notably, the bulk of turnover of small (1–3 employees) shops falls within sales of alcoholic beverages. In 2017, it accounted for nearly 36%, in some shops – as much as 80%.
In 2017, against 2016, retail prices of alcoholic beverages grew by 11.7%, with the largest increase observed in prices of fruit wine – 53.5, beer produced in Lithuania – 27.5, imported beer – 17.2, bitter – 14.5, vodka produced in Lithuania – 12.6%. The growth in prices of alcoholic beverages was conditioned by a higher excise duty applied since 1 March 2017.
In 2017, 1.03 million dekalitres of spirits, expressed in terms of absolute (100%.) alcohol, were produced in Lithuania. Against 2016, their production decreased by 5%. In 2017, production of fermented beverages amounted to 5.5 million dekalitres, which is by 2.3% more than in 2016. In the group of fermented beverages, an increase was recorded in the production of cider (34.1%), non-sparkling fermented beverages (28.7%), sparkling fermented beverages (1.3%), while a decrease – in the production of fruit and berry wine (31.1%). In 2017, the production of grape wine and vermouth amounted to 0.4 million dekalitres, or by 15% less than in 2016. Beer production accounted for the largest proportion – 29.6 million dekalitres; however, over the year, it decreased by 1.1%.
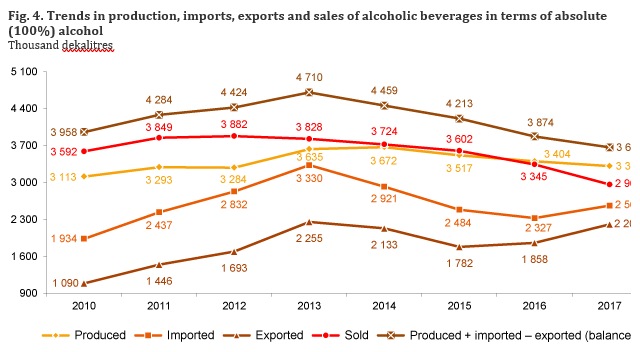
In 2017, against 2016, the largest increase was observed in imports and exports of wine (13.4 and 21.2% respectively) and beer (11.8 and 20.1% respectively). Imports of fermented beverages decreased by 8.8%, exports – increased by 21.2%; imports of spirits increased by 8.5, exports – 14.3%.
In 2017, against 2016, a decrease in the production and sales of alcoholic beverages, expressed in terms of absolute (100%) alcohol, was observed, while imports and exports were on an increase.
According to the data of the Institute of Hygiene, based on the Compulsory Health Insurance Fund Information System, in 2017, 25.7 thousand persons were diagnosed with at least one disease directly linked to alcohol consumption, or 907.6 persons per 100 thousand population. The most frequent diagnoses were alcoholic dependence (623.2 cases per 100 thousand population), toxic effect of alcohol (179.2 cases per 100 thousand population), and alcoholic psychosis (105.1 cases per 100 thousand population). Against 2016, prevalence of alcoholic psychoses decreased by 15.7%, prevalence of alcoholic dependence decreased by 5.4%. The prevalence of diseases directly linked to alcohol consumption is the highest among men aged 35–39, which exceeds that among women more than 3 times. The highest prevalence for rural residents is observed in the 35–39 age group; for urban residents, the peak of prevalence is reached later – at the age of 45–49.
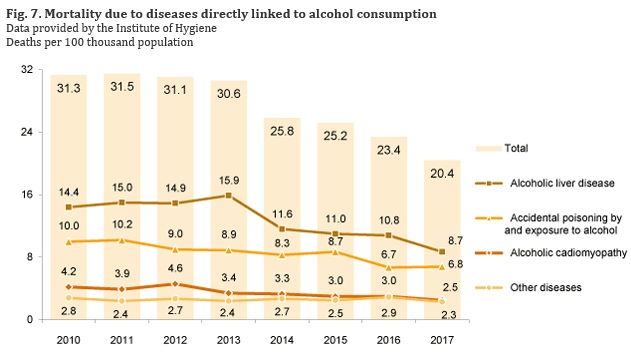
According to the data of the Institute of Hygiene, in 2017, 576 persons died from diseases directly linked to alcohol consumption, which is by 94 less than in 2016. The most frequent alcohol-related diseases were alcoholic liver disease (42.5%), accidental poisoning by and exposure to alcohol (33.5%) and alcoholic cardiomyopathy (12.5%).
In 2017, male mortality due to diseases directly linked to alcohol consumption was 4.6 times as large as female. In 2017, the number of deaths due to alcohol consumption per 100 thousand urban population amounted to 19.6 (in 2016, 22.8), per 100 thousand rural population – to 21.9 (in 2016, 24.5).
According to the data of the Police Department, in 2017, each tenth road traffic accident was caused by a drunk person: 333 road traffic accidents through the fault of drunk persons were registered, with 43 persons killed and 518 injured. In 2017, 18 persons were killed and 297 – injured in road traffic accidents caused by drunk drivers. In 2017, against 2016, the number of road traffic accidents caused by drunk persons decreased by 24.8, of those caused by drunk drivers – decreased by 21.5%.
According to the data of the State Labour Inspectorate, in 2017, 29 intoxicated persons suffered from accidents at work (in 2016, 32); 5 of them died (in 2016, 9). Moreover, 2 intoxicated persons suffered on the way to or from work (in 2016, 6).
According to the data of the Child Rights Protection and Adoption Service, at the end of 2017, 3.9 thousand drinking families at social risk raising children were on the record of municipal child rights protection services (branches) (by 0.2 thousand, or 4.9%, less than in 2016), with 7.1 thousand children raised in them. Over the year, the number of children raised in such families decreased by 0.5 thousand (6.6%).
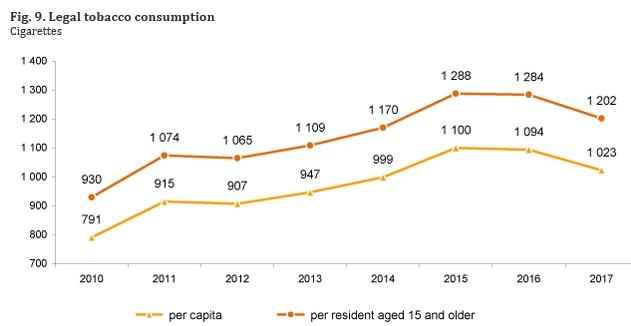
In 2017, 1 202 cigarettes were purchased in retail trade and catering enterprises per resident aged 15 and older (by 6.4% less than in 2016).
In 2017, against 2016, the production of cigarettes decreased by 12.7, exports decreased by 6.9%, while imports increased by 13.8%.
In 2017, against 2016, retail prices of tobacco products grew by 7.5%. The growth in prices of cigarettes was conditioned by a higher excise duty applied since 1 March 2017.
In 2017, 1 650 persons died due to smoking-related malignant neoplasms, which is by 59 less than in 2016; most of them (79.8%) were males. In 2017, there were 58.3 deaths from smoking-related malignant neoplasms per 100 thousand population (urban population – 50.1, rural population – 75.1).
For more information, see the Database of Indicators.
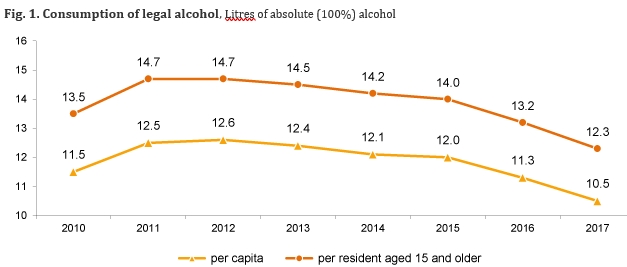
Table 1. Legal alcohol consumption
|
|
2010 |
2011 |
2012 |
2013 |
2014 |
2015 |
2016 |
2017* |
|
Absolute (100%) alcohol,
litres 1 |
|
|
|
|
|
|
|
|
|
per capita |
11.5 |
12.5 |
12.6 |
12.4 |
12.1 |
12.0 |
11.3 |
10.5 |
|
per resident aged 15 and older |
13.5 |
14.7 |
14.7 |
14.5 |
14.2 |
14.0 |
13.2 |
12.3 |
* – provisional
data.
1 In the
calculation of legal alcohol consumption, alcohol sold at border checkpoints
and in duty-free shops and alcohol consumed by foreign tourists in Lithuania is
eliminated, while alcohol consumed by Lithuanian tourists abroad is included.
Table 2. Legal tobacco consumption
|
|
2010 |
2011 |
2012 |
2013 |
2014 |
2015 |
2016 |
2017* |
|
Tobacco products, cigarettes |
|
|
|
|
|
|
|
|
|
per capita |
791 |
915 |
907 |
947 |
999 |
1 100 |
1 094 |
1 023 |
|
per resident aged 15 and older |
930 |
1 074 |
1 065 |
1 109 |
1 170 |
1 288 |
1 284 |
1 202 |
* – provisional data.
Table 3. Sales
of alcoholic beverages and tobacco products
In retail trade
and catering enterprises
|
|
2016 |
2017* |
Growth, drop (–), % |
|
Sales of alcoholic
beverages, thousand dekalitres |
|
|
|
|
Spirits |
3 417 |
3 059 |
–10.5 |
|
Alcoholic cocktails |
441 |
423 |
–4.1 |
|
Wine |
2 151 |
1 670 |
–22.4 |
|
Fermented beverages |
3 005 |
2 539 |
–15.5 |
|
Beer |
25 325 |
23 247 |
–8.2 |
|
Sales of tobacco products,
at current prices, EUR million |
470.9 |
462.9 |
–1.7 |
*
– provisional data.
Table 4. Average
retail prices of alcoholic beverages and tobacco products
EUR
|
|
Measurement unit |
2016 |
2017 |
|
Alcoholic beverages1 |
|
|
|
|
Vodka produced in Lithuania, 40% alcohol |
1 l |
11.66 |
13.32 |
|
Imported vodka, 40% alcohol |
1 l |
19.88 |
20.08 |
|
Liqueur, 20–40% alcohol |
1 l |
17.06 |
16.93 |
|
Whiskey, 40% alcohol |
0.5 l |
11.50 |
11.03 |
|
Brandy, 38% alcohol |
1 l |
16.13 |
17.31 |
|
Bitter,36–43% alcohol |
0.5 l |
6.693 |
7.58 |
|
Non-fortified grape wine, 10–14.5% alcohol |
0.75 l |
6.03 |
6.10 |
|
Fortified dessert wine, 11–17% alcohol |
0.75 l |
3.40 |
3.93 |
|
Fruit wine |
0.7 l |
1.89 |
2.97 |
|
Vermouth |
1 l |
9.38 |
9.07 |
|
Sparkling grape wine |
0.75 l |
4.34 |
4.73 |
|
Beer produced in Lithuania2 |
0.5 l |
0.72 |
0.93 |
|
Imported beer2 |
0.5 l |
0.98 |
1.08 |
|
Tobacco products |
|
|
|
|
Filter-tipped cigarettes by price segment: |
|
|
|
|
first (most expensive) |
20 pc. pack |
3.75 |
4.02 |
|
second (the average price
level) |
20 pc. pack |
3.06 |
3.30 |
|
third (cheapest) |
20 pc. pack |
2.54 |
2.78 |
|
Pipe tobacco |
50 g |
7.66 |
7.95 |
1 The list
of representative alcoholic beverages is annually updated taking into account changes
in the assortment of beverages on the market. In different years, the
statistical price survey covers alcoholic beverages of various alcohol content
imported from different countries and produced by different manufacturers.
2 Excl. the
price of the container.
3 20–50% alcohol.
Table 5. Changes
in retail prices of alcoholic beverages and tobacco products
Against the
previous year,%
|
|
2016 |
2017 |
|
All alcoholic beverages |
2.2 |
11.7 |
|
Spirits1 |
2.4 |
5.7 |
|
Wine, fermented beverages2 |
1.9 |
7.4 |
|
Beer |
1.8 |
25.9 |
|
Tobacco products |
7.5 |
7.5 |
1 Vodka,
liqueur, cognac, brandy, bitter, whisky, rum, gin, tequila, alcoholic
cocktails.
2 Non-fortified
grape wine, fortified dessert wine, fruit wine, sparkling wine, vermouth,
cider.
Table 6.
Production of alcoholic beverages and cigarettes
|
|
2016 |
2017 |
Growth, drop (–), % |
|
Alcoholic beverages, thousand dekalitres |
|
|
|
|
Spirits, incl. alcoholic cocktails, 100% alcohol |
1 086 |
1 031 |
–5.0 |
|
Wine |
481 |
409 |
–15.0 |
|
Fermented beverages |
5 335 |
5 460 |
2.3 |
|
Beer |
29 991 |
29 651 |
–1.1 |
|
Cigarette production index (previous
year – 100%) |
104.8 |
87.3 |
X |
Table 7. Imports of alcoholic beverages and cigarettes
|
|
2016 |
2017◘ |
Growth, drop (–), % |
|
Alcoholic beverages, thousand dekalitres |
|
|
|
|
Spirits, incl. alcoholic cocktails, 100% alcohol |
837 |
909 |
8.5 |
|
Wine |
8 776 |
9 952 |
13.4 |
|
Fermented beverages |
1 679 |
1 532 |
–8.8 |
|
Beer |
5 272 |
5 896 |
11.8 |
|
Cigarettes, million pcs. |
3 811.0 |
4 335.2 |
13.8 |
◘ –
non-final data.
Table 8. Exports
of alcoholic beverages and cigarettes
|
|
2016 |
2017◘ |
Growth, drop (–), % |
|
Alcoholic beverages, thousand dekalitres |
|
|
|
|
Spirits, incl. alcoholic cocktails, 100% alcohol |
516 |
590 |
14.3 |
|
Wine |
5 518 |
6 687 |
21.2 |
|
Fermented beverages |
2 984 |
3 615 |
21.2 |
|
Beer |
6 823 |
8 198 |
20.1 |
|
Cigarettes, million pcs. |
30 248.9 |
28 172.7 |
–6.9 |
◘ –
non-final data.
Table 9. Average
monthly net earnings, their changes and purchasing power
|
|
2016 |
2017 |
|
Net earnings, EUR |
602.3 |
660.2 |
|
Change, against the previous year,% |
8.7 |
9.6 |
|
Capacity to purchase
alcoholic beverages, litres |
|
|
|
Vodka produced in Lithuania, 40% alcohol |
52 |
50 |
|
Imported vodka, 40% alcohol |
30 |
33 |
|
Liqueur, 20–40% alcohol |
35 |
39 |
|
Whiskey, 40% alcohol |
26 |
30 |
|
Brandy, 38% alcohol |
37 |
38 |
|
Bitter, 36–43% alcohol |
451 |
44 |
|
Non-fortified grape wine, 10–14.5% alcohol |
75 |
81 |
|
Fortified dessert wine, 11–17% alcohol |
133 |
126 |
|
Fruit wine |
223 |
156 |
|
Vermouth |
64 |
73 |
|
Sparkling grape wine |
104 |
105 |
|
Beer produced in Lithuania |
418 |
355 |
|
Imported beer |
307 |
306 |
|
Capacity to purchase tobacco
products, 20 pc. packs |
|
|
|
Filter-tipped cigarettes by price segment: |
|
|
|
first (most expensive) |
161 |
164 |
|
second (the average price
level) |
197 |
200 |
|
third (cheapest) |
237 |
237 |
|
Pipe tobacco, 50 g. |
79 |
83 |
1 20–50%
alcohol.
Table 10. Number
of persons diagnosed with diseases directly linked to alcohol consumption
Data provided by
the Institute of Hygiene. Data source – Compulsory Health
Insurance Fund Information System Sveidra
|
|
ICD-10-AM1code |
2016 |
2017* |
||||||||
|
Total |
males |
females |
urban areas3 |
rural areas3 |
Total |
males |
females |
urban areas |
rural areas |
||
|
Total2 |
|
28 056 |
21 619 |
6 437 |
16 415 |
11 415 |
25 677 |
19 606 |
6 071 |
14 961 |
10 462 |
|
of
which: |
|
|
|
|
|
|
|
|
|
|
|
|
alcoholic
psychosis |
F10.4-F10.7 |
3 575 |
2 912 |
663 |
1 876 |
1 662 |
2 974 |
2 406 |
568 |
1 609 |
1 338 |
|
alcoholic
dependence |
F10.0-F10.3 |
18 896 |
14 544 |
4 352 |
10 971 |
7 768 |
17 630 |
13 393 |
4 237 |
10 202 |
7 257 |
|
degeneration of the nervous
system due to alcohol |
G31.2 |
2 090 |
1 700 |
390 |
1 194 |
883 |
1 984 |
1 667 |
317 |
1 102 |
866 |
|
special
epileptic syndromes |
G40.5 |
1 701 |
1 433 |
268 |
931 |
763 |
1 517 |
1 289 |
228 |
834 |
671 |
|
alcoholic
polyneuropathy |
G62.1 |
1 660 |
1 362 |
298 |
884 |
760 |
1 740 |
1 399 |
341 |
936 |
786 |
|
alcoholic liver disease |
K70 |
2 850 |
2 169 |
681 |
1 791 |
1 042 |
2 657 |
2 019 |
638 |
1 641 |
991 |
|
toxic
effect of alcohol |
T51 |
5 547 |
4 290 |
1 257 |
3 758 |
1 742 |
5 069 |
3 904 |
1 165 |
3 444 |
1 575 |
|
other diseases |
G72.1, I42.6, K29.2, K85.2, K86.0, O35.4, P04.3, Q86.0 |
1 384 |
1 085 |
299 |
781 |
590 |
1 155 |
893 |
262 |
671 |
467 |
|
Per 100 thousandpopulation |
|
978.2 |
1 636.7 |
416.0 |
851.8 |
1 213.0 |
907.6 |
1 502.3 |
398.4 |
788.2 |
1 124.0 |
|
alcoholic
psychosis |
F10.4-F10.7 |
124.6 |
220.5 |
42.8 |
97.3 |
176.6 |
105.1 |
184.4 |
37.3 |
84.8 |
143.8 |
|
alcoholic
dependence |
F10.0-F10.3 |
658.8 |
1 101.1 |
281.3 |
569.3 |
825.4 |
623.2 |
1 026.2 |
278.0 |
537.4 |
779.7 |
|
degeneration of the nervous
system due to alcohol |
G31.2 |
72.9 |
128.7 |
25.2 |
62.0 |
93.8 |
70.1 |
127.7 |
20.8 |
58.1 |
93.0 |
|
special
epileptic syndromes |
G40.5 |
59.3 |
108.5 |
17.3 |
48.3 |
81.1 |
53.6 |
98.8 |
15.0 |
43.9 |
72.1 |
|
alcoholic
polyneuropathy |
G62.1 |
57.9 |
103.1 |
19.3 |
45.9 |
80.8 |
61.5 |
107.2 |
22.4 |
49.3 |
84.4 |
|
alcoholic liver disease |
K70 |
99.4 |
164.2 |
44.0 |
92.9 |
110.7 |
93.9 |
154.7 |
41.9 |
86.4 |
106.5 |
|
toxic
effect of alcohol |
T51 |
193.4 |
324.8 |
81.2 |
195.0 |
185.1 |
179.2 |
299.1 |
76.4 |
181.4 |
169.2 |
|
other diseases |
G72.1, I42.6, K29.2, K85.2, K86.0, O35.4, P04.3, Q86.0 |
48.3 |
82.1 |
19.3 |
40.5 |
62.7 |
40.8 |
68.4 |
17.2 |
35.3 |
50.2 |
* – provisional data.
1 International Statistical
Classification of Diseases and Related Health Problems, Tenth Revision,
Australian Modification.
2 If a person was diagnosed with more than one disease, s/he was included in
more than one row of the table. In the row “Total”, such a person was included
only once.
3 In 2016, place
of residence was not indicated by 226 persons, in 2017 – by 254 persons;
therefore, the sum of persons by place of residence is smaller than number in
the column “Total”.
Table 11.
Incidence of certain smoking-related diseases
Data provided by
the Institute of Hygiene, aged 15 and older
|
|
2016 |
2017* |
|
The number of newly
registered diseases |
|
|
|
diseases of the circulatory system |
232 810 |
280 971 |
|
diseases of the respiratory system: |
654 248 |
674 916 |
|
chronic lower respiratory diseases |
31 396 |
33 264 |
|
Per 100 thousand population |
|
|
|
diseases of the circulatory system |
9 520.7 |
11 674.7 |
|
diseases of the respiratory system: |
26 755.4 |
28 043.5 |
|
chronic lower respiratory diseases |
1 283.9 |
1 382.2 |
|
The number of incidence |
|
|
|
malignant neoplasms: |
|
|
|
trachea, bronchus, lung |
1 442 |
1 540 |
|
lip, oral cavity, throat |
688 |
668 |
|
larynx |
299 |
329 |
|
Per 100 thousand population |
|
|
|
malignant neoplasms: |
|
|
|
trachea, bronchus, lung |
59.0 |
64.0 |
|
lip, oral cavity, throat |
28.1 |
27.8 |
|
larynx |
12.2 |
13.7 |
*
– provisional data.
Table 12.
Mortality due to diseases directly linked to alcohol consumption, liver
cirrhosis and fibrosis
Data provided by
the Institute of Hygiene
|
|
2016 |
2017* |
||||||||
|
Total |
males |
females |
urban areas |
rural areas |
Total |
males |
females |
urban areas |
rural areas |
|
|
Number of deaths due
to diseases directly linked to alcohol consumption |
670 |
509 |
161 |
439 |
231 |
576 |
459 |
117 |
372 |
204 |
|
of which due to: |
|
|
|
|
|
|
|
|
|
|
|
alcoholic liver disease |
309 |
224 |
85 |
207 |
102 |
245 |
182 |
63 |
163 |
82 |
|
accidental poisoning by and
exposure to alcohol |
193 |
141 |
52 |
123 |
70 |
193 |
155 |
38 |
124 |
69 |
|
alcoholic cardiomyopathy |
82 |
67 |
15 |
58 |
24 |
72 |
64 |
8 |
41 |
31 |
|
other diseases |
86 |
77 |
9 |
51 |
35 |
66 |
58 |
8 |
44 |
22 |
|
Per 100 thousand population |
23.4 |
38.5 |
10.4 |
22.8 |
24.5 |
20.4 |
35.2 |
7.7 |
19.6 |
21.9 |
|
of which due to: |
|
|
|
|
|
|
|
|
|
|
|
alcoholic liver disease |
10.8 |
17.0 |
5.5 |
10.7 |
10.8 |
8.7 |
13.9 |
4.1 |
8.6 |
8.8 |
|
accidental poisoning by and
exposure to alcohol |
6.7 |
10.7 |
3.4 |
6.4 |
7.4 |
6.8 |
11.9 |
2.5 |
6.5 |
7.4 |
|
alcoholic cardiomyopathy |
2.9 |
5.1 |
1.0 |
3.0 |
2.6 |
2.5 |
4.9 |
0.5 |
2.2 |
3.3 |
|
other diseases |
3.0 |
5.8 |
0.6 |
2.6 |
3.7 |
2.3 |
4.4 |
0.5 |
2.3 |
2.4 |
|
Deaths due to liver
cirrhosis and fibrosis |
448 |
280 |
168 |
331 |
117 |
418 |
249 |
169 |
303 |
115 |
|
Per 100 thousand population |
15.6 |
21.2 |
10.9 |
17.2 |
12.4 |
14.8 |
19.1 |
11.1 |
16.0 |
12.4 |
*
– provisional data.
Table 13.
Mortality due to smoking-related malignant neoplasms
Data provided by
the Institute of Hygiene
|
|
2016 |
2017* |
||||||||
|
Total |
males |
females |
urban areas |
rural areas |
Total |
males |
females |
urban areas |
rural areas |
|
|
Number of deaths due to
smoking-related malignant neoplasms |
1 709 |
1 387 |
322 |
1 047 |
662 |
1 650 |
1 317 |
333 |
951 |
699 |
|
trachea, bronchi and lung |
1 293 |
1 031 |
262 |
813 |
480 |
1 231 |
962 |
269 |
732 |
499 |
|
lip, oral cavity, and pharynx |
283 |
227 |
56 |
158 |
125 |
302 |
245 |
57 |
166 |
136 |
|
larynx |
133 |
129 |
4 |
76 |
57 |
117 |
110 |
7 |
53 |
64 |
|
Per 100 thousand population |
59.6 |
105.0 |
20.8 |
54.3 |
70.3 |
58.3 |
100.9 |
21.9 |
50.1 |
75.1 |
|
trachea, bronchi and lung |
45.1 |
78.1 |
16.9 |
42.2 |
51.0 |
43.5 |
73.7 |
17.7 |
38.6 |
53.6 |
|
lip, oral cavity, and pharynx |
9.9 |
17.2 |
3.6 |
8.2 |
13.3 |
10.7 |
18.8 |
3.7 |
8.7 |
14.6 |
|
larynx |
4.6 |
9.8 |
0.3 |
3.9 |
6.1 |
4.1 |
8.4 |
0.5 |
2.8 |
6.9 |
*
– provisional data.
Table 14. Road
traffic accidents through the fault of drunk persons
Data of the
Police Department
|
|
2016 |
2017* |
Growth, drop (–), % |
|
Road traffic accidents, total |
3 213 |
3 192 |
–0.7 |
|
Killed1 |
192 |
192 |
- |
|
Injured |
3 768 |
3 752 |
–0.4 |
|
of whom children under 18 |
608 |
591 |
–2.8 |
|
Road traffic accidents
through the fault of drunk persons, total |
443 |
333 |
–24.8 |
|
of which through the fault of drunk drivers |
237 |
186 |
–21.5 |
|
Killed1 |
77 |
43 |
–44.2 |
|
of whom through the fault of drunk drivers |
18 |
11 |
–38.9 |
|
Injured |
724 |
518 |
–28.5 |
|
of whom through the fault of drunk drivers |
297 |
250 |
–15.8 |
* – provisional
data.
1 Persons killed refers to persons who died from injuries suffered in a
road traffic accident outright or within 30 days of the accident.


 «The Baltic Course» Is Sold and Stays in Business!
