
Analytics, Baltic Export, Baltic States – CIS, EU – Baltic States, Foreign trade , Latvia
International Internet Magazine. Baltic States news & analytics
Friday, 26.04.2024, 08:52
Foreign trade turnover in Latvia decreased to EUR 22 860.1 mln in 2015
 Print version
In December 2015 compared to November 2015 foreign trade turnover at current prices in Latvia decreased by 10.3%, exports value of goods dropped by 12.6% and imports value – by 8.3%. In December, the amount of goods exported by Latvia comprised EUR 817.0 million, while the amount of imported goods constituted EUR 972.5 million. The foreign trade balance became worse as exports in the total amount of foreign trade dropped to 45.7% (in November 2015 – 46.9%).
Main changes in exports in December compared to November:
· Exports of machinery and mechanical appliances, electrical equipment dropped by EUR 39.5 million or 22.6%,
· Exports of basic metals and articles of basic metals fell by EUR 18.6 million or 25.6%,
· Exports of vegetable products dropped by EUR 16.7 million or 16.9%,
· Exports of mineral products went down by EUR 9.7 million or 17.9%,
· Exports of wood and articles of wood decreased by EUR 9.6 million or 6.9%,
· Exports of optical instruments and apparatus (including medical); clocks and watches; musical instruments increased by EUR 8.0 million or 51.9%.
Main changes in imports in December compared to November:
· Imports of machinery and mechanical appliances, electrical equipment dropped by EUR 28.0 million or 11.9%,
· Imports of products of the chemical and alien industries went down by EUR 18.9 million or 15.5%,
· Imports of mineral products dropped by EUR 10.0 million or 8.1%,
· Imports of plastics and articles of plastics, rubber and articles of rubber reduced by EUR9.1 million or 16.2%,
· Imports of prepared foodstuffs fell by EUR8.3 million or 8.6%,
· Imports of animals and animal products increased by EUR 4.5 million or 14.9%.
Foreign trade partners
In December the most important exports partners in trade with EU countries were Lithuania (18.3% of total exports), Estonia (11.8%), the United Kingdom (5.3%) and Germany (5.2%), but main imports partners – Lithuania (18.2% of total imports), Germany (11.4%), Poland (9.7%) and Estonia (7.5%).
Russia was the key partner in trade with third countries, comprising 9.7% in the total exports of Latvia and 10.6% in the total imports of Latvia in December.
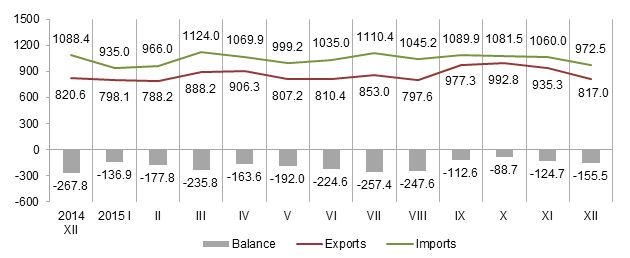 |
| Latvia’s foreign trade, million EUR |
Changes of foreign trade goods in December
The rise in exports of cereals in December 2015 as compared to December 2014 was caused by the increase of exports of wheat and wheat and rye mix by EUR 31.1 million or 2.9 times. Whereas due to the decline in exports of diesel by EUR 9.3 million or 34.4%, exports of mineral fuels, mineral oils and products of their distillation diminished.
The rise in imports of alcoholic and non-alcoholic beverages in December 2015 as compared to December 2014 was caused by the increase in imports of strong alcoholic beverages by EUR 2.4 million or 23.2%. While drop in imports of mineral fuel, oil and oil products was mostly affected by the drop in imports of diesel by EUR 19.7 million or 29.5%.
More information on Latvia’s foreign trade by months and quarters by country groups and commodity groups is available in the CSB data base section "Foreign trade".
Latvia's foreign trade in December 2015 by country group, at current prices
|
|
Exports |
Imports |
||||
|
|
million EUR |
% of total |
Changes as% over November 2015 |
million EUR |
% of total |
Changes as% over November 2015 |
|
Total |
817.0 |
100 |
-12.6 |
972.5 |
100 |
-8.3 |
|
European Union countries |
556.5 |
68.1 |
-13.7 |
759.3 |
78.1 |
-8.4 |
|
Euro Area countries |
378.1 |
46.3 |
-16.1 |
563.0 |
57.9 |
-5.5 |
|
CIS countries |
114.1 |
14.0 |
-0.1 |
132.3 |
13.6 |
-1.5 |
|
Other countries |
146.4 |
17.9 |
-17.0 |
80.9 |
8.3 |
-16.3 |
Changes in main commodities in Latvia’s exports in December 2015, at current prices
|
|
thousand EUR |
% of total |
Changes as% over |
||
|
December 2014 |
November 2015 |
average of previous 12 months |
|||
|
Total |
817 020 |
100 |
-0.4 |
-12.6 |
-5.5 |
|
wood and wood products; wood charcoal |
130 120 |
15.9 |
0.5 |
-6.9 |
-10.0 |
|
electrical machinery and equipment |
83 464 |
10.2 |
-23.1 |
-35.0 |
-24.1 |
|
cereals |
60 088 |
7.4 |
3.3 times |
-20.4 |
2.0 times |
|
machinery and mechanical appliances |
52 076 |
6.4 |
-0.8 |
11.5 |
1.3 |
|
beverages, spirits and vinegar |
44 868 |
5.5 |
-22.7 |
-13.1 |
32.2 |
|
mineral fuels, mineral oils and products of their distillation |
41 173 |
5.0 |
-24.1 |
-17.0 |
-29.0 |
|
vehicles other than railway or tramway rolling stock, and parts and accessories thereof |
39 288 |
4.8 |
18.4 |
-5.5 |
2.5 |
|
pharmaceutical products |
28 111 |
3.4 |
7.1 |
-2.6 |
3.6 |
|
articles of iron or steel |
22 386 |
2.7 |
-4.6 |
-22.1 |
-19.9 |
|
optical instruments and apparatus (including medical) |
21 586 |
2.6 |
44.8 |
46.3 |
55.7 |
Changes in main commodities in Latvia’s imports in December 2015, at current prices
|
|
thousand EUR |
% of total |
Changes as % over |
||
|
December 2014 |
November 2015 |
average of previous 12 months |
|||
|
Total |
972 451 |
100 |
-10.7 |
-8.3 |
-7.4 |
|
mineral fuels, mineral oils and products of their distillation |
109 428 |
11.3 |
-28.5 |
-8.2 |
-10.2 |
|
electrical machinery and equipment |
104 761 |
10.8 |
-21.1 |
-19.9 |
-18.7 |
|
machinery and mechanical appliances |
102 753 |
10.6 |
-7.8 |
-2.0 |
0.4 |
|
vehicles other than railway or tramway rolling stock, and parts and accessories thereof |
78 316 |
8.1 |
-19.0 |
4.8 |
-0.3 |
|
pharmaceutical products |
45 715 |
4.7 |
6.2 |
-13.6 |
5.6 |
|
plastics and articles thereof |
35 714 |
3.7 |
-9.0 |
-14.5 |
-17.1 |
|
wood and wood products; wood charcoal |
30 826 |
3.2 |
9.0 |
-0.5 |
-0.2 |
|
beverages, spirits and vinegar |
30 630 |
3.1 |
12.1 |
-16.9 |
10.5 |
|
iron and steel |
26 925 |
2.8 |
-1.1 |
-1.4 |
-26.6 |


 «The Baltic Course» Is Sold and Stays in Business!
