
Analytics, Baltic States – CIS, EU – Baltic States, Investments, Lithuania, Markets and Companies
International Internet Magazine. Baltic States news & analytics
Saturday, 09.05.2026, 17:35
FDI flow in Lithuania in Q3 amounted to EUR 247.2 mln
 Print version
Please note that this news release presents the foreign direct investment (FDI) FDI calculated by applying directional principle, i.e. by estimating reverse investment. Therefore, the data differ from the direct investment information provided in the balances of payments and international investment where assets and liabilities principle is applied for the calculation of the said investment.
Foreign direct investment in Lithuania
Based on provisional data, FDI flow in Lithuania in III quarter 2015, as in II quarter 2015, remained positive, and amounted to EUR 247.2 million, which shows an increase in investment in Lithuania. The increase in FDI was determined by an increase in reinvestment and investment in equity instruments by non-residents (EUR 295 million and EUR 93.4 million respectively). Over the first three quarters of 2015, FDI in Lithuania amounted to EUR 564.3 million (2% of GDP).
Table 1. Foreign direct investment flow into Lithuania, EUR million
|
|
III quarter 2015 |
II quarter 2015 |
IV quarter 2014 |
|
Total |
247.17 |
65.23 |
–209.08 |
|
Equity instruments, excl. reinvestment |
93.37 |
42.97 |
616.04 |
|
Reinvestment |
294.99 |
–132.00 |
–56.81 |
|
Debt instruments |
–141.19 |
154.26 |
–768.31 |
In III quarter 2015, the largest increase was observed in FDI from Sweden (EUR 57.6 million), the United Kingdom (EUR 47.5 million) and Finland (EUR 34.3 million), while decrease – Poland (minus EUR 71.7 million), Luxembourg (minus EUR 24.8 million) and France (minus EUR 22.4 million).
Over III quarter 2015, the largest investment was made in real estate activities (EUR 70.5 million), wholesale and retail trade, repair of motor vehicles and motorcycles (EUR 70.3 million), financial and insurance activities (EUR 63.2 million), while the largest decrease was observed for investment in professional, scientific and technical activities (minus EUR 31.3 million).
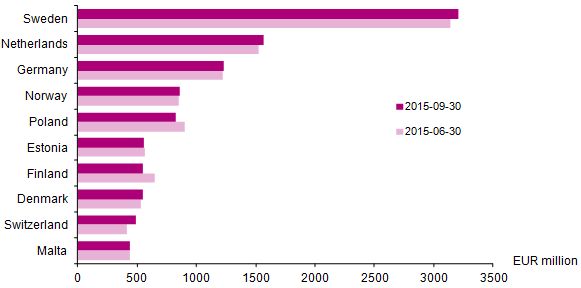 |
| Cumulative foreign direct investment by investing country |
As of 30 September 2015, cumulative FDI in Lithuania amounted to EUR 13.2 billion. Over the first three quarters of 2015, its sum in Lithuania increased by EUR 307 million (2.4%); FDI per capita amounted to, on average, EUR 4 548 (as of 31 December 2014, EUR 4 404).
According to the data of 30 September 2015, the largest investment in Lithuania was made by Swedish – EUR 3.2 billion (24.3%), Dutch – EUR 1.6 billion (11.9%), German – EUR 1.2 billion (9.4%), Norwegian – EUR 861 million (6.5%), Polish – EUR 825.5 million (6.3%), and Estonian – EUR 560.8 million (4.3% of the total FDI) investors. Cumulative FDI in Lithuania from the EU member states amounted to EUR 10.9 billion (82.6%), from the euro area countries – EUR 5.9 billion (44.7%), from the CIS countries – EUR 300.3 million (2.3% of the total FDI).
Table 2. Cumulative foreign direct investment in Lithuania, EUR million
|
|
2015-09-30 |
2015-06-30 |
2014-12-31 |
|
Total |
13 171.85 |
13 103.51 |
12 864.83 |
|
Equity instruments |
10 965.72 |
10 618.77 |
10 709.29 |
|
Debt instruments |
2 206.13 |
2 484.74 |
2 155.54 |
According to the data of 30 September 2015, the largest investment was made in
financial and insurance activities – EUR 3.6 billion (27.2%), manufacturing –
EUR 2.8 billion (21.2%), real estate activities – EUR 1.8 billion (13.6%),
wholesale and retail trade, repair of motor vehicles and motorcycles – EUR 1.5
billion (11.4%), information and communication – EUR 1.1 billion (8.7% of the
total FDI). In manufacturing, the largest investment was made in the
manufacture of refined petroleum products, chemicals and chemical products and
pharmaceutical preparations – EUR 1.2 billion (44.5%), the
manufacture of food products, beverages and tobacco products –
EUR 361.5 million (12.9% of the total FDI in manufacturing).
Lithuanian direct investment abroad
In III quarter 2015, Lithuanian direct investment (DI) flow abroad was negative and amounted to EUR 13.3 million, although in II quarter 2015, Lithuanian DI abroad increased by EUR 153.9 million. In III quarter 2015, the negative Lithuanian DI flow was determined by a decrease in investment in debt instruments –EUR 28.3 million.
Table 3. Lithuanian direct investment flow abroad*, EUR million
|
|
III quarter 2015 |
II quarter 2015 |
IV quarter 2014 |
|
Total |
–13.26 |
153.93 |
–18.68 |
|
Equity instruments, excl. reinvestment |
19.23 |
20.40 |
–9.08 |
|
Reinvestment |
–4.15 |
5.62 |
6.73 |
|
Debt instruments |
–28.34 |
127.90 |
–16.33 |
* – In some tables provided in the news release and annex, insignificant
deviations due to rounding are possible.
In III quarter 2015, the fastest growth in Lithuanian DI was observed in Romania (EUR 5.6 million), Belarus (EUR 3.4 million) and Sweden (EUR 3.3 million), by economic activity – wholesale and retail trade, repair of motor vehicles and motorcycles (EUR 4.8 million) and real estate activities (EUR 2.2 million). The largest decrease in Lithuanian DI was observed in Germany (minus EUR 10.9 million), Poland (minus EUR 10.5 million) and Russia (minus EUR 6.4 million), by economic activity – manufacturing (minus EUR 12.8 million).
As of 30 September 2015, Lithuanian cumulative DI abroad amounted to EUR 2.1 billion. Over the first three quarters of 2015, its sum in Lithuania decreased by EUR 242.8 million (10.4%).
According to the data of 30 September 2015, the largest investment was made in Luxembourg – EUR 485.2 million (23.2%), the Netherlands – EUR 461.3 million (22.1%), Poland – EUR 298.9 million (14.3%), Latvia – EUR 271.7 million (13%), Cyprus – EUR 141.5 million (6.8%), Belarus – EUR 75.3 million (3.6% of the total Lithuanian DI abroad). Lithuanian cumulative DI to the EU member states amounted to EUR 1.9 billion (90.7%), to the euro area counties – EUR 1.5 billion (70.7%), to the CIS countries – EUR 172.5 million (8.3% of the total Lithuanian DI abroad).
Table 4. Lithuanian cumulative direct investment abroad, EUR million
|
|
2015-09-30 |
2015-06-30 |
2014-12-31 |
|
Total |
2 087.21 |
2 214.40 |
2 329.99 |
|
Equity instruments |
1 768.49 |
1 792.84 |
1 940.88 |
|
Debt instruments |
318.71 |
421.56 |
389.11 |
The largest investment abroad was made by Lithuanian investors in professional,
scientific and technical activities – EUR 1 billion (49.5%),
wholesale and retail trade, repair of motor vehicles and motorcycles –
EUR 308.7 million (14.8%), administrative and support activities –
EUR 280.4 million (13.4%), manufacturing – EUR 122.5 million (5.9%), real
estate activities – EUR 119.5 million (5.7% of the total Lithuanian
DI abroad). In manufacturing, the largest investment was made in the
manufacture of refined petroleum products, chemicals and chemical products and
pharmaceutical preparations (67.4% of the total Lithuanian DI in manufacturing
abroad).
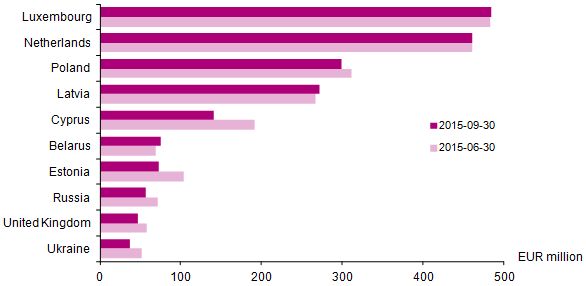 |
| Lithuanian cumulative direct investment abroad by country |
More detailed statistical information on cumulative FDI in Lithuania and Lithuanian DI abroad broken down by country and economic activity is provided in the Annex.
Statistical data on foreign direct investment in IV quarter 2015 is due in
April 2016.
Table 5. Cumulative foreign direct investment by investing country
|
|
2015-09-30 |
2015-06-30 |
|||
|
EUR million |
structure, % |
change,
against |
EUR million |
structure, % |
|
|
Total |
13 171.85 |
100.0 |
0.5 |
13 103.51 |
100.0 |
|
Sweden |
3 204.56 |
24.3 |
1.9 |
3 144.83 |
24.0 |
|
Netherlands |
1 569.61 |
11.9 |
3.1 |
1 522.21 |
11.6 |
|
Germany |
1 231.58 |
9.4 |
0.8 |
1 221.35 |
9.3 |
|
Norway |
860.95 |
6.5 |
1.2 |
850.82 |
6.5 |
|
Poland |
825.48 |
6.3 |
–8.8 |
905.49 |
6.9 |
|
Estonia |
560.80 |
4.3 |
–1.4 |
568.57 |
4.3 |
|
Finland |
552.81 |
4.2 |
–15.0 |
650.18 |
5.0 |
|
Denmark |
552.61 |
4.2 |
4.3 |
529.62 |
4.0 |
|
Switzerland |
488.07 |
3.7 |
17.2 |
416.29 |
3.2 |
|
Malta |
442.43 |
3.4 |
0.0 |
442.62 |
3.4 |
|
Other |
2 882.95 |
21.8 |
1.1 |
2 851.53 |
21.8 |
Table 6. Cumulative foreign direct investment by economic activity
|
|
2015-09-30 |
2015-06-30 |
|||
|
EUR million |
structure, % |
change,
against |
EUR million |
structure, % |
|
|
Total |
13 171.85 |
100.0 |
0.5 |
13 103.51 |
100.0 |
|
Financial and insurance activities |
3 581.26 |
27.2 |
–0.1 |
3 584.89 |
27.4 |
|
Manufacturing |
2 797.86 |
21.2 |
–0.9 |
2 821.96 |
21.5 |
|
Real estate activities |
1 786.67 |
13.6 |
7.1 |
1 668.14 |
12.7 |
|
Wholesale and retail trade; repair of motor vehicles and motorcycles |
1 495.37 |
11.4 |
–2.0 |
1 525.58 |
11.6 |
|
Information and communication |
1 145.81 |
8.7 |
–0.5 |
1 151.34 |
8.8 |
|
Professional, scientific and technical activities |
487.33 |
3.7 |
–12.5 |
557.11 |
4.3 |
|
Construction |
342.30 |
2.6 |
–0.9 |
345.45 |
2.6 |
|
Purchase and sale of real estate |
322.41 |
2.4 |
–8.4 |
351.95 |
2.7 |
|
Transportation and storage |
311.80 |
2.4 |
4.0 |
299.85 |
2.3 |
|
Other |
901.04 |
6.8 |
13.0 |
797.24 |
6.1 |
Table 7. Lithuanian cumulative direct investment abroad by country
|
|
2015-09-30 |
2015-06-30 |
|||
|
EUR million |
structure, % |
change,
against |
EUR million |
structure, % |
|
|
Total |
2 087.21 |
100.0 |
–5.7 |
2 214.40 |
100.0 |
|
Luxembourg |
485.17 |
23.2 |
0.3 |
483.85 |
21.9 |
|
Netherlands |
461.34 |
22.1 |
0.1 |
460.80 |
20.8 |
|
Poland |
298.92 |
14.3 |
–4.1 |
311.84 |
14.1 |
|
Latvia |
271.68 |
13.0 |
1.6 |
267.28 |
12.1 |
|
Cyprus |
141.51 |
6.8 |
–26.4 |
192.29 |
8.7 |
|
Belarus |
75.33 |
3.6 |
7.9 |
69.83 |
3.2 |
|
Estonia |
72.71 |
3.5 |
–30.4 |
104.45 |
4.7 |
|
Russia |
56.90 |
2.7 |
–20.9 |
71.93 |
3.2 |
|
United Kingdom |
46.69 |
2.2 |
–20.2 |
58.52 |
2.6 |
|
Ukraine |
37.46 |
1.8 |
–28.1 |
52.10 |
2.4 |
|
Other |
139.50 |
6.8 |
–1.4 |
141.51 |
6.3 |
Table 8. Lithuanian cumulative direct investment abroad by economic activity
|
|
2015-09-30 |
2015-06-30 |
|||
|
EUR million |
structure, % |
change,
against |
EUR million |
structure, % |
|
|
Total |
2 087.21 |
100.0 |
–5.7 |
2 214.40 |
100.0 |
|
Professional, scientific and technical activities |
1 032.61 |
49.5 |
–0.2 |
1 034.34 |
46.7 |
|
Wholesale and retail trade; repair of motor vehicles and motorcycles |
308.67 |
14.8 |
16.2 |
265.53 |
12.0 |
|
Administrative and support activities |
280.41 |
13.4 |
12.4 t. |
22.65 |
1.0 |
|
Manufacturing |
122.47 |
5.9 |
–70.2 |
410.63 |
18.5 |
|
Real estate activities |
119.47 |
5.7 |
–5.8 |
126.86 |
5.7 |
|
Financial and insurance activities |
74.38 |
3.6 |
4.5 |
71.19 |
3.2 |
|
Purchase and sale of real estate |
53.97 |
2.6 |
–56.5 |
124.06 |
5.6 |
|
Information and communication |
52.97 |
2.5 |
1.7 |
52.08 |
2.4 |
|
Construction |
21.94 |
1.1 |
5.8 |
20.74 |
0.9 |
|
Other |
20.32 |
0.9 |
–76.5 |
86.32 |
4.0 |
Concepts
Equity instruments refers to company's equity capital comprised of equity securities, shares of investment funds, other assets (e.g. real estate), reinvestment, reserves included in equity capital.
Reinvestments refers to the proportion of direct investor's profit not distributed by subsidiary or partner companies in the form of dividend and profit of branches not transferred to the direct investor.
Debt instruments refers to financial instruments when it is obligatory to return the principal sum in the future and/or pay interest. It includes loans, debt securities, trade credits and advance payments, other amounts payable and receivable.


 «The Baltic Course» Is Sold and Stays in Business!
