Analytics, Foreign trade , Latvia, Statistics
International Internet Magazine. Baltic States news & analytics
Tuesday, 31.03.2026, 21:42
Latvia: In October value of goods exported from Latvia was 0.5% larger than a year ago
 Print version
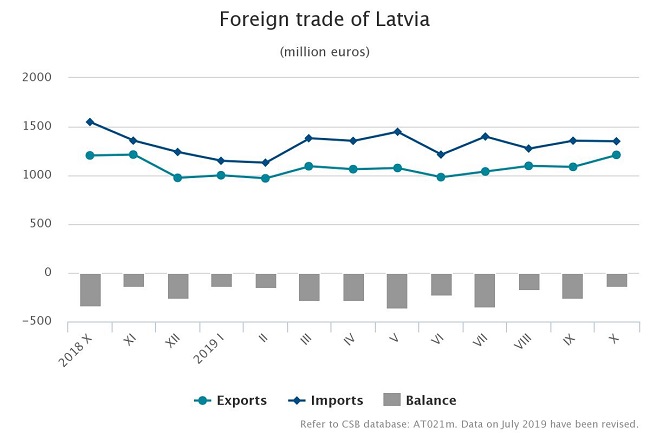
In October,
Latvia exported goods in the amount of EUR 1.21 bn, but imported in
the amount of EUR 1.35 bn. Compared to October 2018,
foreign trade balance has improved as exports in total foreign trade amount
increased from 43.8% to 47.3 %.
Over the
ten months of this year, the foreign trade turnover of Latvia at current prices
reached EUR 23.68 bn – EUR 77.7 mln or 0.3% less than in
the corresponding period of 2018. The exports value constituted
EUR 10.62 bn (an increase of EUR 62.5 mln or 0.6%),
whereas the imports value – EUR 13.06 bn (a drop of
EUR 140.2 mln or 1.1%).
Calendar
and seasonally adjusted data show that, compared to October 2018, in
October 2019 the exports value at current prices went down by 0.9% and the
imports value by 12.8%, whereas, compared to the previous month, the exports
value went up by 1%, but the imports value reduced by 4.4%.
Main
changes in exports in October 2019, compared to October 2018:
- exports of vegetable products up by EUR 50.9 mln or 69.4%,
- exports of prepared foodstuffs up by EUR 15.8 mln or 13.7%,
- exports of textiles and textile articles up by EUR 9.9 mln
or 31.5%,
- exports of wood and articles of wood down by
EUR 25.8 mln or 12.4%,
- exports of mineral products down by EUR 21.6 mln or
30.2%,
- exports
of basic metals and articles of basic metals down by
EUR 18.7 mln or 17.7%.
Main
changes in imports in October 2019, compared to October 2018:
- imports of prepared foodstuffs up by EUR 15.4 mln or 12.9%
- imports of vehicles and associated transport equipment down by
EUR 91.4 mln or 45%,
- imports of mineral products down by EUR 57.1 mln or
30.6%,
- imports of machinery and mechanical appliances;
electrical equipment down by EUR 44 mln or 13.3%,
- imports
of basic metals and articles of basic metals down by
EUR 20.3 mln or 15.6%.
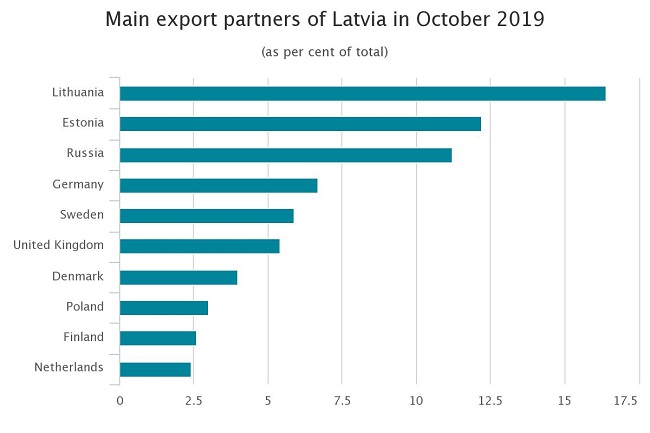
In October,
the main export partners of Latvia in trade with EU countries were Lithuania
(16.4% of total exports), Estonia (12.2%), Germany (6.7%) and Sweden (5.9%),
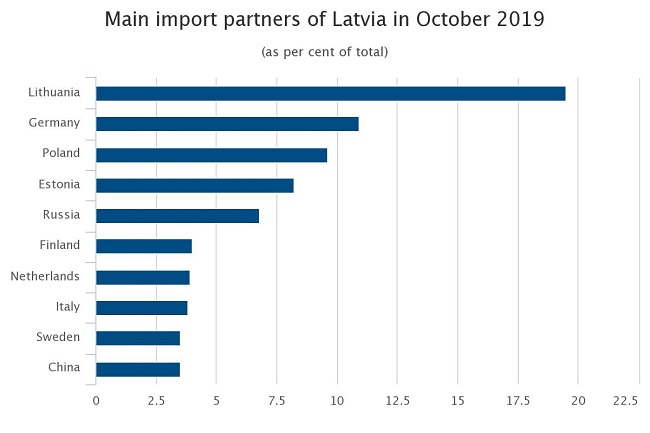
whereas the main import partners were Lithuania (19.5% of total imports),
Germany (10.9%), Poland (9.6%) and Estonia (8.2%). Main partner in trade with
third countries was Russia, share of which in total exports of Latvia in
October comprised 11.2%, but in imports – 6.8%.
In October 2019, compared to October 2018, share
of the European Union countries in total exports value fell by
1.3 percentage points, but in imports value – grew by 8.3 percentage
points. Rise in share of CIS countries comprised 1.9 percentage points in
exports and drop of 2.6 percentage points in imports.
Foreign
trade of Latvia by country group in October 2019
(at current prices)
|
|
Exports |
Imports |
||||
|
|
million EUR |
%
of total |
changes
as %, compared to October 2018 |
million EUR |
%
of total |
changes
as %, compared to October 2018 |
|
Total |
1 210.2 |
100 |
0.5 |
1 350.1 |
100 |
-12.8 |
|
European Union countries |
841.2 |
69.5 |
-1.4 |
1 080.1 |
80.0 |
-2.6 |
|
euro area countries |
589.8 |
48.7 |
3.1 |
800.8 |
59.3 |
-2.9 |
|
CIS countries |
186.0 |
15.4 |
14.7 |
140.9 |
10.4 |
-30.0 |
|
other countries |
183.0 |
15.1 |
-3.1 |
129.1 |
9.6 |
-45.6 |
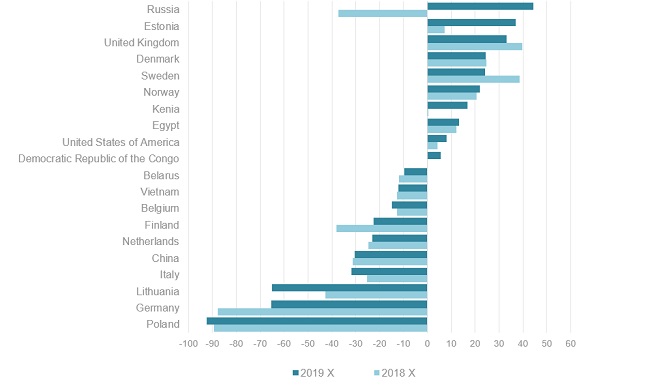
In October 2019 foreign trade balance of Latvia was
positive with 132 partner countries, as exports value of goods exceeded
imports value of goods. It was negative in trade with 43 countries.
Balance of foreign trade of Latvia
(difference between value of goods exports and imports, million euros)
The rise in the exports of cereals in October 2019, as
compared to October 2018, was facilitated by an increase in the exports of
wheat and meslin by EUR 16.4 mln or 51.7%. In turn, reduction in
exports of mineral fuels, mineral oils and products of their distillation was
mostly influenced by decrease of exports of electricity by EUR 6.6 mln
or 44.4%.
Main
commodities in exports of Latvia in October 2019
(at current prices)
|
|
thousand EUR |
as %
of total |
Changes
as %, compared to |
||
|
October 2018 |
September 2019 |
average
of previous 12 months |
|||
|
Total |
1 210 237 |
100 |
0.5 |
11.3 |
13.4 |
|
182 897 |
15.1 |
-12.4 |
12.5 |
-3.3 |
|
|
127 857 |
10.6 |
2.2 |
13.5 |
13.9 |
|
|
79 353 |
6.6 |
16.9 |
20.6 |
48.6 |
|
|
75 283 |
6.2 |
2 times |
26.8 |
2 times |
|
|
65 571 |
5.4 |
-23.4 |
6.9 |
-1.4 |
|
|
vehicles
other than railway or tramway rolling stock, and parts and accessories
thereof |
61 794 |
5.1 |
-5.5 |
6.1 |
2.8 |
|
54 751 |
4.5 |
16.9 |
40.1 |
37.1 |
|
|
mineral
fuels, mineral oils and products of their distillation |
44 018 |
3.6 |
-33.1 |
3.6 |
-16.5 |
|
38 979 |
3.2 |
2.6 |
-8.7 |
5.8 |
|
|
furniture,
other furnishing articles; prefabricated buildings |
38 949 |
3.2 |
17.5 |
14.7 |
27.9 |
The rise in the imports of alcoholic and non-alcoholic
beverages in October 2019, as compared to October 2018, was
facilitated by an increase in the imports of sparkling wine by
EUR 2.6 mln or 49.3%. In its turn, reduction of imports of mineral
fuels, mineral oils and products of their distillation was mostly influenced by
decrease of imports of natural gas in the gaseous state by EUR 26.2 mln
or 50.4%.
Main
commodities in imports of Latvia in October 2019
(at current prices)
|
|
thousand EUR |
as %
of total |
Changes
as %, compared to |
||
|
October
2018 |
September 2019 |
average
of previous 12 months |
|||
|
Total |
1 350 135 |
100 |
-12.8 |
-0.4 |
2.2 |
|
162 313 |
12.0 |
-0.7 |
17.1 |
19.8 |
|
|
124 840 |
9.2 |
-25.6 |
4.1 |
-5.0 |
|
|
mineral fuels, mineral oils and products of their
distillation |
122 926 |
9.1 |
-31.6 |
-8.7 |
-2.1 |
|
vehicles other than railway or tramway rolling stock, and
parts and accessories thereof |
105 250 |
7.8 |
-22.4 |
4.5 |
-6.9 |
|
59 392 |
4.4 |
-1.8 |
20.1 |
11.8 |
|
|
58 407 |
4.3 |
10.5 |
-3.5 |
20.1 |
|
|
55 158 |
4.1 |
-3.5 |
1.5 |
2.9 |
|
|
49 824 |
3.7 |
-21.1 |
24.9 |
1.8 |
|
|
49 351 |
3.7 |
-11.4 |
8.7 |
1.3 |
|
|
33 040 |
2.4 |
-11.3 |
2.2 |
0.9 |
|


 «The Baltic Course» Is Sold and Stays in Business!