Analytics, Foreign trade , Latvia, Statistics
International Internet Magazine. Baltic States news & analytics
Friday, 26.04.2024, 22:35
In August value of goods exported from Latvia was 2.1% smaller than a year ago
 Print version
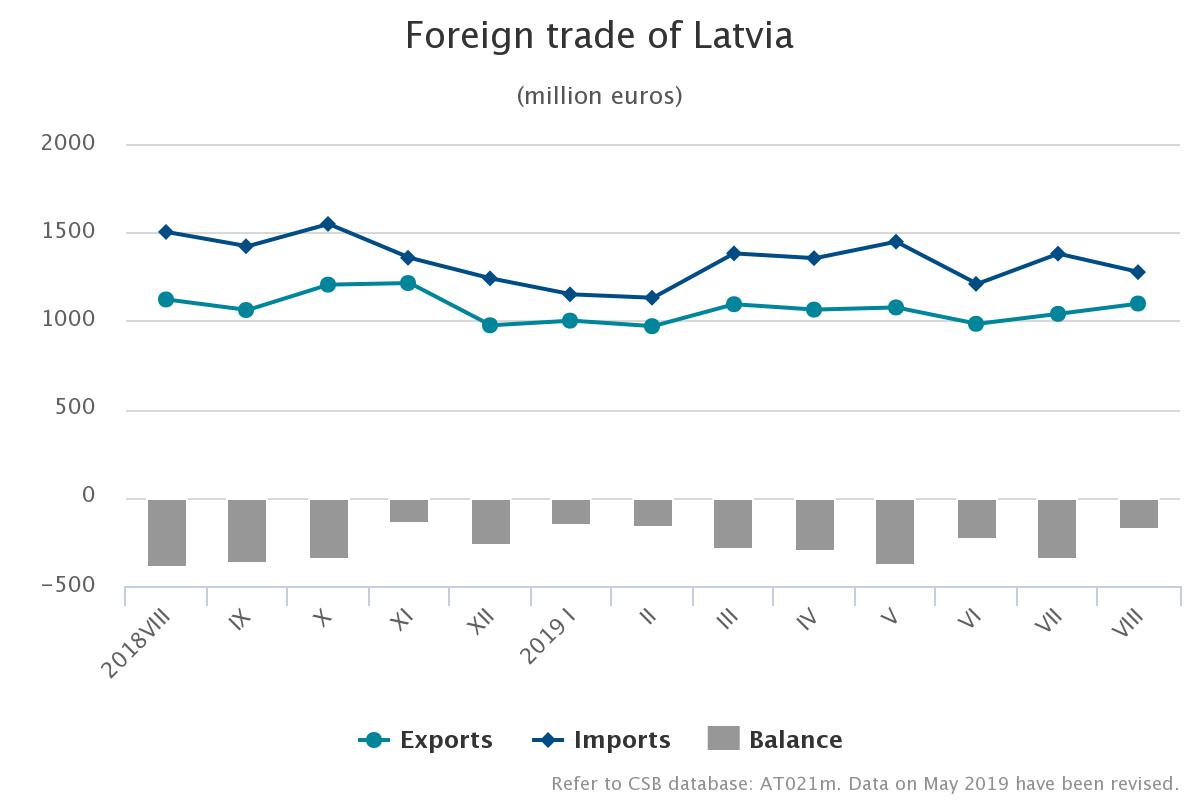
In August,
Latvia exported goods in the amount of EUR 1.1 bn, but imported in
the amount of EUR 1.28 bn. Compared to August 2018, foreign
trade balance has improved as exports in total foreign trade amount increased
from 42.7% to 46.3%.
Over the
first eight months of this year, the foreign trade turnover of Latvia at
current prices reached EUR 18.65 bn – EUR 131.3 mln or 0.7%
more than in the corresponding period of 2018. The exports value constituted
EUR 8.32 bn (an increase of EUR 31.7 mln or 0.4 %),
whereas the imports value – EUR 10.33 bn (an upturn of
EUR 99.6 mln or 1%).
Calendar
and seasonally adjusted data show that, compared to August 2018, in
August 2019 the exports value at current prices went down by 0.5% and the
imports value – by 13.2%, whereas, compared to the previous month, the exports
value went up by 1.7% ,but the imports value – reduced by 2.8%.
Main
changes in exports in August 2019, compared to August 2018:
- exports of vegetable products
up by EUR 63.7 mln or 2.1 times,
- exports of products of the
chemical and allied industries up by EUR 19.2 mln or 27.7%,
- exports of machinery and
mechanical appliances; electrical equipment down by EUR 43.9 mln
or 20.1%,
- exports of wood and articles of
wood down by EUR 31.6 mln or 15%,
- exports of vehicles and
associated transport equipment down by EUR 17.1 mln or 24.1%.
Main
changes in imports in August 2019, compared to August 2018:
- imports of textiles and textile
articles up by EUR 7.7 mln or 15.8%,
- imports of mineral products
down by EUR 112.6 mln or 41.8%,
- imports of vehicles, aircraft,
vessels and associated transport equipment down by EUR 70.3 mln
or 41.9%,
- imports of machinery and mechanical
appliances; electrical equipment down by EUR 43.2 mln or 15.4%,
- imports of basic metals and
articles of basic metals down by EUR 15.5 mln or 13.7%.
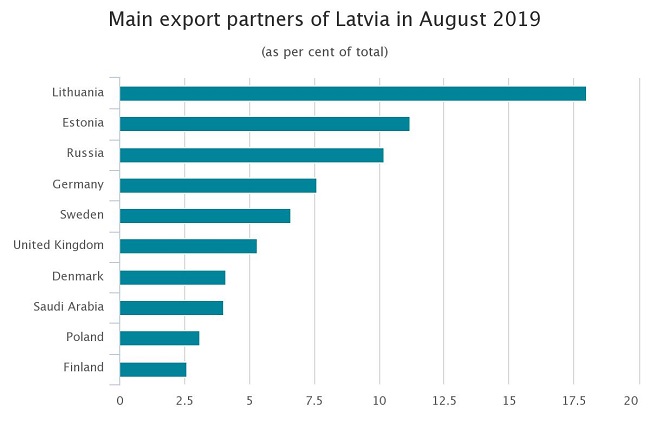
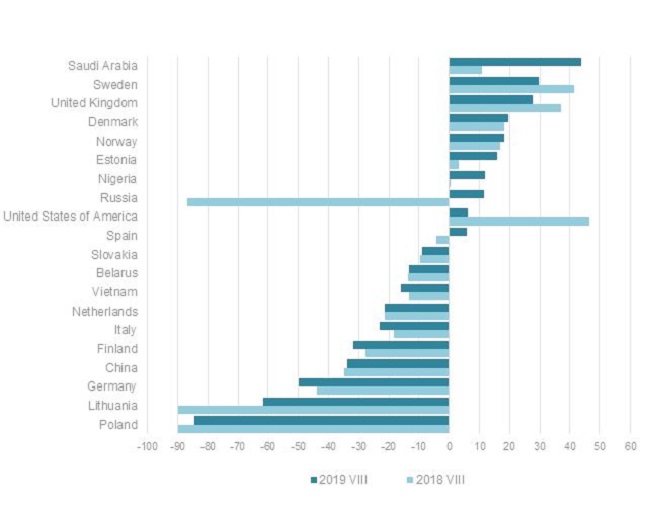
In August,
the main export partners of Latvia in trade with EU countries were Lithuania
(18% of total exports), Estonia (11.2%), Germany (7.6%) and Sweden (6.6%),
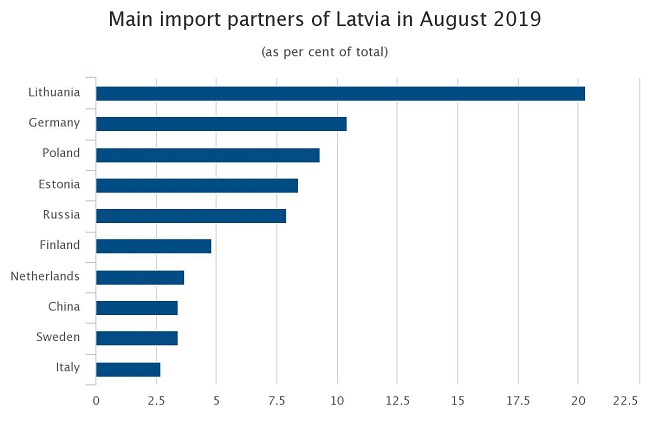
whereas the main import partners were Lithuania (20.3% of total imports),
Germany (10.4%), Poland (9.3%) and Estonia (8.4%). Russia was the main partner
in trade with third countries; its share in total Latvian exports in August
accounted for 10.2 %, whereas in imports – for 7.9%.
In August 2019, compared to August 2018, share of
the European Union countries in Latvian foreign trade grew – by 0.5 percentage
points in the total exports value and by 9.6 percentage points in the imports
value. Rise in share of CIS countries comprised 1.5 percentage points in
exports and drop of 4.1 percentage point in imports.
Foreign
trade of Latvia in August 2019 by country group
(at current prices)
|
|
Exports |
Imports |
||||
|
|
million EUR |
% of total |
changes
as %, compared to August 2018 |
million EUR |
% of total |
changes
as %, compared to August 2018 |
|
Total |
1 097.7 |
100 |
-2.1 |
1 275.2 |
100 |
-15.1 |
|
European Union countries |
779.9 |
71.0 |
-1.3 |
1 004.8 |
78.8 |
-3.4 |
|
euro area countries |
544.0 |
49.6 |
1.5 |
745.1 |
58.4 |
-2.9 |
|
CIS countries |
153.5 |
14.0 |
9.8 |
147.3 |
11.5 |
-37.0 |
|
other countries |
164.3 |
15.0 |
-13.7 |
123.1 |
9.7 |
-46.1 |
In August 2019 foreign trade balance of Latvia was
positive with 114 partner countries, as exports value of goods exceeded imports
value of goods. It was negative in trade with 44 countries.
The rise in the exports of cereals in August 2019, as
compared to August 2018, was facilitated by an increase in the exports of
wheat and meslin by EUR 52.9 mln or 4.1 time. But exports of
machinery and mechanical appliances reduced as exports of turbojets,
turbopropellers and other gas turbines dropped by EUR 51.1 mln.
Main
commodities in exports of Latvia in August 2019
(at current prices)
|
|
Thousand EUR |
As %
of total |
Changes
as %, compared to |
||
|
August 2018 |
July 2019 |
average
of previous 12 months |
|||
|
Total |
1 097 681 |
100 |
-2.1 |
5.6 |
2.9 |
|
wood and articles of wood; wood charcoal |
178 142 |
16.2 |
-15.1 |
1.1 |
-7.9 |
|
electrical machinery and equipment |
111 856 |
10.2 |
5.3 |
-3.4 |
1.0 |
|
cereals |
80 037 |
7.3 |
3.1 time |
19.3 times |
2.5 times |
|
machinery and mechanical appliances |
62 386 |
5.7 |
-44.2 |
-10.6 |
-14.8 |
|
beverages, spirits and vinegar |
58 330 |
5.3 |
-7.9 |
7.7 |
8.9 |
|
vehicles other than railway or tramway rolling
stock, and parts and accessories thereof |
50 845 |
4.6 |
-7.0 |
-13.5 |
-15.0 |
|
mineral fuels, mineral oils and products of their
distillation |
44 630 |
4.1 |
-25.6 |
-10.0 |
-18.8 |
|
pharmaceutical products |
43 046 |
3.9 |
41.0 |
8.2 |
11.3 |
|
articles of iron and steel |
39 416 |
3.6 |
9.5 |
6.1 |
10.2 |
|
furniture, other furnishing articles; prefabricated
buildings |
31 684 |
2.9 |
-3.3 |
4.9 |
4.6 |
Rise of imports of iron and steel in August 2019, as
compared to August 2018, was mostly affected by the increase in imports of
articles of iron and steel for railways and tramways of EUR 2.4 mln
or 10.7%. In its turn, reduction of imports of mineral fuels, mineral
oils and products of their distillation was mostly influenced by decrease of
imports of natural gas in the gaseous state by EUR 73.8 mln or 66.1%.
Main
commodities in imports of Latvia in August 2019
(at current prices)
|
|
Thousand EUR |
As %
of total |
Changes
as %, compared to |
||
|
August 2018 |
July 2019 |
average
of previous 12 months |
|||
|
Total |
1 275 235 |
100 |
-15.1 |
-7.6 |
-5.1 |
|
mineral fuels, mineral oils and products of their
distillation |
150 868 |
11.8 |
-42.6 |
-10.1 |
6.4 |
|
electrical machinery and equipment |
131 723 |
10.3 |
-3.1 |
-7.2 |
-3.4 |
|
machinery and mechanical appliances |
105 806 |
8.3 |
-26.9 |
-21.2 |
-22.3 |
|
vehicles other than railway or tramway rolling
stock, and parts and accessories thereof |
93 003 |
7.3 |
0.3 |
-21.9 |
-16.9 |
|
beverages, spirits and vinegar |
53 468 |
4.2 |
-9.6 |
-0.9 |
10.7 |
|
plastics and articles thereof |
52 034 |
4.1 |
-3.7 |
-14.4 |
-2.8 |
|
wood and articles of wood; wood charcoal |
46 239 |
3.6 |
-4.6 |
11.4 |
-5.8 |
|
pharmaceutical products |
45 138 |
3.5 |
-3.9 |
-5.9 |
-14.6 |
|
articles of iron and steel |
38 448 |
3.0 |
15.2 |
2.6 |
19.7 |
|
iron and steel |
35 667 |
2.8 |
-33.7 |
-28.1 |
-31.4 |


 «The Baltic Course» Is Sold and Stays in Business!