
Analytics, Baltic Export, Baltic States – CIS, EU – Baltic States, Foreign trade , Good for Business, Latvia
International Internet Magazine. Baltic States news & analytics
Saturday, 27.04.2024, 04:36
In July, exports value of goods and imports value increased in Latvia
 Print version
In July foreign trade balance slightly improved as exports in total foreign trade value increased to 44.6% (in June 2014 – 44.1%).
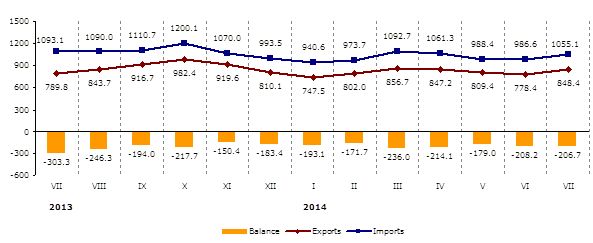 |
| Latvia’s foreign trade, in mln euros (1) |
In July compared to June exports of machinery and mechanical appliances; electrical equipment rose by 21.8 mln euros or 17.5%. The largest increase was observed in exports to Lithuania – by 7.4 mln euros or 27.0% (mainly exports of mobile phones) and to Russia – by 3.3 mln euros or 20.8% (mainly exports of fixed capacitors). But imports of these goods grew by 47.4 mln euros or 26.3%: from China – by 10.0 mln euros or 86.9% (mainly imports of machines for the reception of voice, images or other data) and from Germany – by 7.9 mln euros or 37.3% (mainly imports of machines for working various hard materials).
Main changes in exports in July, compared to June:
- exports of mineral products increased by 22.7 mln euros or 36.8%,
- exports of wood and articles of wood rose by 16.2 mln euros or 11.2%,
- exports of products of the chemical and allied industries reduced by 11.6 mln euros or 16.9%.
Main changes in imports in July, compared to June:
- imports of plastics and articles thereof grew by 9.9 mln euros or 16.9%,
- imports of textiles and textile articles increased by 6.8 mln euros or 15.5%,
- imports of vehicles and associated transport equipment dropped by 20.3 mln euros or 25.0%.
Foreign trade of Latvia by country group in July 2014, at current prices
|
|
Exports |
Imports |
||||
|
|
mln euros |
% of total |
In % (+, –) over June 2014 |
mln euros |
% of total |
In % (+, –) over June 2014 |
|
Total |
848.4 |
100 |
+9.0 |
1 055.1 |
100 |
+6.9 |
|
Member States of the European Union |
617.0 |
72.7 |
+10.1 |
837.8 |
79.4 |
+5.6 |
|
Euro area countries |
262.2 |
30.9 |
+8.2 |
449.1 |
42.6 |
+9.9 |
|
CIS countries |
125.4 |
14.8 |
+3.0 |
120.4 |
11.4 |
+4.7 |
|
Other countries |
106.1 |
12.5 |
+10.0 |
96.8 |
9.2 |
+23.4 |
In July main export partners were Lithuania (19.4% of total export), Estonia (11.5%), Germany (7.3%) and Poland (6.9%); main import partners were Lithuania (15.1% of total import), Poland (11.3%), Germany (10.7%), Estonia (8.4%) and Finland (5.8%). In July share of exports in trade with Russia comprised 11.1%, but in imports – 5.5%.
Changes of main commodities in Latvia’s export in July 2014, at current prices
|
|
thsd euros |
% of total |
% (+, –) over |
||
|
July 2013 |
June 2014 |
average of previous 12 months |
|||
|
Total |
848 430 |
100 |
+7.4 |
+9.0 |
+0.8 |
|
wood and wood products; wood charcoal |
160 227 |
18.9 |
+31.3 |
+11.2 |
+14.3 |
|
electrical machinery and equipment |
99 336 |
11.7 |
+22.3 |
+23.3 |
+14.6 |
|
mineral fuels, mineral oils and products of their distillation |
77 350 |
9.1 |
-6.2 |
+38.9 |
+15.3 |
|
machinery and mechanical appliances |
46 979 |
5.5 |
-3.4 |
+6.8 |
+7.8 |
|
beverages, spirits and vinegar |
37 143 |
4.4 |
-10.4 |
+18.2 |
-9.5 |
|
iron and steel |
36 596 |
4.3 |
+8.8 |
+19.5 |
+10.8 |
|
passenger cars |
30 306 |
3.6 |
+8.9 |
+8.7 |
-4.4 |
|
articles of iron and steel |
29 299 |
3.5 |
+30.5 |
+6.2 |
+5.1 |
|
dairy produce, eggs, natural honey |
23 574 |
2.8 |
-1.0 |
-3.5 |
+0.5 |
|
plastics and articles thereof |
22 990 |
2.7 |
+13.7 |
+8.1 |
+17.0 |
Rise of exports of wood and wood products, wood charcoal in July 2014, as compared to July 2013, was mostly affected by the increase in exports of sawn wood of 15.5 mln euros or 41.3%. But exports of beverages, spirits and vinegar reduced rapidly as exports of spirits dropped by 2.9 mln euros or 9.7%.
Changes of main commodities in Latvia’s import in July 2014, at current prices
|
|
thsd euros |
% of total |
% (+, –) over |
||
|
July 2013 |
June 2014 |
average of previous 12 months |
|||
|
Total |
1 055 056 |
100 |
-3.5 |
+6.9 |
+0.5 |
|
mineral fuels, mineral oils and products of their distillation |
134 202 |
12.7 |
-20.6 |
-2.9 |
-16.1 |
|
electrical machinery and equipment |
124 824 |
11.8 |
+29.2 |
+29.0 |
+20.6 |
|
machinery and mechanical appliances |
102 310 |
9.7 |
+3.9 |
+23.3 |
+13.1 |
|
passenger cars |
57 104 |
5.4 |
-19.5 |
-11.4 |
-18.2 |
|
plastics and articles thereof |
45 011 |
4.3 |
-2.5 |
+3.3 |
+7.8 |
|
pharmaceutical products |
43 667 |
4.1 |
+6.9 |
+0.6 |
+1.3 |
|
iron and steel |
39 872 |
3.8 |
+16.1 |
+4.8 |
+5.4 |
Rise of imports of electrical machinery and equipment in July 2014, as compared to July 2013, was mostly affected by the increase in imports of mobile phones of 12.6 mln euros or 46.7%. In its turn, reduction of imports of mineral fuels, mineral oils and products of their distillation was influenced by decrease of imports of diesel oil by 26.2 mln euros or 28.8%.
More information on Latvia’s foreign trade by month and quarter, by country group and commodity group is available in the CSB data base section „Foreign trade” Short term statistical data.
1Data on April 2014 have been revised.


 «The Baltic Course» Is Sold and Stays in Business!
