
Analytics, EU – Baltic States, Good for Business, Industry, Investments, Markets and Companies
International Internet Magazine. Baltic States news & analytics
Monday, 20.04.2026, 18:21
Industry as the only driving force for European progress
 Print version
According to a European Commission report on the current status of EU industry (17 February 2014), most production sectors have still not regained their pre-crisis level of output and significant differences exist between sectors among the EU member states.
The analytical report has a challenging title – "EU industrial structure report 2013: Competing in Global Value Chains". First, it sheds more light on trends in manufacturing sectors; second, it shows that “internal” European consumption is not enough for progressive development. Thus, the report highlights mutually beneficial links between manufacturing and services as well as the importance of global value chains.
The report ultimately underlines the growing need to mainstream industrial competitiveness into other policy fields.
These issues have been highlighted in the Commission's Communication on a European Industrial Renaissance and were the subject of the Competitiveness Council meeting (20-21 February 2014).
Commission’s opinion
On the occasion of publishing the report, the European Commission Vice-President Antonio Tajani, responsible for Industry and Entrepreneurship underlined that the report showed that the 2008 crisis led to a significant acceleration of European industrial decline, and that industry needed presently a “targeted support” to help it return to growth.
He stressed that “Europe was still far from the 20% target of industry’s share in Europe’s GDP by 2020; to meet this goal we need to focus on re-industrialization”. The Commission is calling on the member states to support the new industrial compact at the Competitiveness Council and make more targeted recommendation for the states.
Reference: European Commission, Press release, IP/14/150 “2013 industrial structure report highlights need for industrial renaissance”, 17/02/2014.
The main findings of the report
The report showed that the fragile recovery hinted at by positive growth
in 2010-11 was interrupted by a downturn in the business cycle and EU
industries experienced a double dip. It also confirmed that since 2001, manufacturing sectors declined further by 3 percentage points, to
around 15% of GDP in 2012 (as a proportion of economic output).
The main findings of the report include the following assumptions:
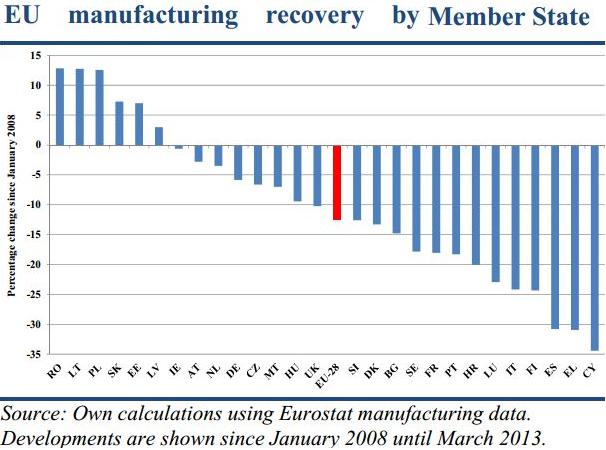
Country differences
Overall EU manufacturing output masks significant differences between the EU member states. Strong recoveries can be seen in Romania, Poland and Slovakia; somehow the Commission is of the opinion that the Baltic States too regained and exceeded their pre-recession peaks.
Sector differences
High tech, pharmaceuticals and staples (e.g. food and beverages) resisted crisis: there are also significant differences between sectors. Construction, manufacturing and mining industries were badly hit. Industries producing consumer staples such as food, beverages and pharmaceuticals, fared relatively better. High-technology manufacturing industries were not impacted to the same extent as other industries.
Productivity gains
Differences vary, and are concentrated in high tech industries. Thus, productivity and employment gains varied significantly across sectors, with a general decline in manufacturing, in particular in low-tech industries. In the aftermath of the latest crisis, EU manufacturing managed to reduce labour costs and increase productivity, with high-tech industries as the main engine of growth. High-tech is being more resilient to the negative effect of the financial crisis thanks to both higher productivity and limited dependence on energy.
Productivity gains are concentrated in high-tech industries: in the aftermath of the latest crisis, EU manufacturing managed to reduce labour costs and increase productivity. In particular, high-tech industries have been the main engine of growth. They have been more resilient to the negative effect of the financial crisis thanks to higher productivity and limited dependence on energy.
The specialization in high-tech and low energy intensive industries is crucial for the strategic positioning of industries in the global value chain. This translates into above-average contributions to overall productivity growth and thus to real income growth. However, data on patent applications show that many high- and medium-tech industries in the EU still perform relatively poorly compared to the world aggregate and, in particular, the US. This lack of innovation threatens future gains in productivity.
Services growing faster than manufacturing
On average, during 2000-12, market services (those typically provided by the private sector) grew by 1,7 percentage points in the EU, and now make up half of EU GDP. The share of non-market services (typically provided by the public sector) also increased, reaching 23% of GDP in 2012; hence, during 2001-10, employment grew in the service industries, whereas it declined in manufacturing.
Links between manufacturing and services
These links are mutually beneficial: the pharmaceuticals sector has experienced sustained growth since the start of the financial crisis, while high technology manufacturing industries (high-tech) have not been, generally, affected to the same extent as other industries. Manufacturing firms are increasingly using services as part of their business processes; in the development and sale of products, and for horizontal business activities such as accounting and logistics. Higher productivity growth in manufacturing can spill over to other sectors. The increased interdependence between manufacturing and services implies a “carrier function” of manufacturing for services that might otherwise have limited tradability. The interconnections between manufacturing and services are growing, as products are becoming more sophisticated and incorporate higher services content.
A good example is the marketing of "smart" mobile phones which require the use of other services such as software applications (commonly known as "apps"), to maximize their usefulness. The app service providers would have a much smaller market without the access given by manufacturers of the app using devices. This carrier function also stimulates innovation and qualitative upgrading for service activities.
Through these linkages, higher productivity growth in manufacturing can spill over to service sectors. This is particularly important in view of the fact that, in the first decade of 2000’s, employment grew only in the service industries. Hence, a strong manufacturing sector can help mainstream competitiveness gains across other sectors of the economy.
This has a stimulus effect on innovation and qualitative upgrading for
service activities.
Services are important for the competitiveness of manufacturing; growing share of services in GDP is explained by higher income elasticity of demand for services, which tend to shift final demand towards services, as incomes grow over time. Falling relative prices of manufacturing compared to services due to higher productivity growth in manufacturing also tend to reduce the relative share of manufacturing in nominal terms.
With respect to employment, the sectoral shift is even more pronounced, due to the fact, that services are more labour intensive and typically have lower productivity growth.
The inter-linkages between manufacturing and services are growing. Manufacturing firms’ use of intermediate services has increased across almost all industries since 1995.
Manufacturing is changing from being dominated by machine operators and
assembly line workers to a sector, which relies more and more on service
occupations and service inputs. This shows up in the increased share of
employees with services-related occupations, including activities such as
R&D, engineering design, software design, market research, marketing,
organizational design and after-sales training, maintenance and support
services.
Analysis of trade in services indicates that the EU has a comparative advantage in almost all sectors except construction and travel. By comparison, the US economy has a comparative advantage in relatively few sectors (financial and insurance services and travel). Russia and China specialise in construction services, as does Japan. India is highly specialised in computer and information services, while Brazil exhibits high RCA (revealed comparative advantage) values in other business services.
Global value chains and EU industry
The EU is still the largest player in world trade, both in terms of goods and services and investment flows. Globalisation has transformed firms’ ‘value chains’ through the creation of an increasing number of established cross-border networks. While EU enterprises are already involved in global value chains, strengthening their participation will increase their competitiveness and ensure access to global markets in more favourable competitive conditions.
The EU remains a leader in global trade; the importance of the EU single market to global trade figures is illustrated by export figures. Exports originating in EU-27 countries (Croatia was not part of the EU during the study period of the report), including intra-EU trade, accounted for 37% of total world exports in 2011.
Trade among EU countries represented 25 % of world-manufactured trade in 2011; by comparison, intra-regional trade in Asia reached about 17 % of world trade and in North America about 4%.
The EU is also the world's largest trading bloc. In 2010, EU exports to countries outside the EU accounted for 16% of world trade whilst about 25% of total world exports took place within the EU-28.
The EU has also a large share of world trade in manufactured goods: exports originating in EU-28 countries (including intra-EU trade) accounted for 37% of total world exports in 2011. In 2012 the EU, Asia and North America accounted for 78 % of total world exports in goods.
World trade flows mostly involve developed countries
Most high‑income countries’ trade takes place with other high‑income countries. In all manufacturing sectors except textiles, paper, machinery, electrical equipment and basic metals, half or more of EU-28 exports are to high‑ income countries. The EU has largest world market shares in all industrial sectors (at the 2-digit level) except for computers, textiles, clothing and leather (where the leader is China).The highest market shares for EU manufacturing industries are in printing and reproduction of recorded media, tobacco, beverages, pharmaceuticals, paper and paper products and motor vehicles.
Some fast growing economic competitors are still dependent on high tech inputs from other countries
China has comparative advantages in both high-tech and low-tech manufactures. However, while China has exported proportionally more technology-intensive goods in recent years, much of the content was imported from developed countries. Data on trade in value added confirms that the share of imported high-tech inputs is still higher in China than in the EU, especially for high-tech products.
Foreign investments in manufacturing
Increasing global trade flows have been accompanied by even stronger growth in global capital flows, including foreign direct investment (FDI) needed by EU industry.
EU-28 account for a significant proportion of global FDI flows (around 22 % of inflows and 30 % of outflows), but both inflows and outflows have been badly hit by the crisis. In 2010, EU FDI inflows were approximately a third of their 2007 level and outflows had fallen even further. Most of the fall in EU FDI inflows was due to a sharp drop in intra-EU flows since the start of the crisis.
The
EU is still the world leader in terms of global trade. The EU has comparative
advantage in two-thirds of its exports. The EU needs to build upon its
strengths to help reverse the trend of a declining contribution of
manufacturing to national income, thus confirming the need to facilitate the
internationalization and the integration of EU firms in global value chains.
Investment
has fallen sharply and still focuses on finance and real estate. Industry
needs investment.
Stocks of inward and outward EU FDI are concentrated in the financial and real estate sectors. Financial intermediation, real estate and business activities represent about three‑quarters of overall outward stock and about two thirds of inward stock.
Source: http://europa.eu/rapid/press-release_MEMO-14-111_en.htmLatvian efforts: example
From the EU's long-term financial planning period (2014-20), about € 500 million would be available for Latvian projects in perspective research and innovation projects.
The entire funding should not be invested in one sector. It is necessary to balance sectors' financial appetite, explained Latvian Economy minister, Vjaceslavs Dombrovskis.
There are five “smart” specialization areas in Latvian “manufacturing” (in line with the EU-2020 strategy), i.e. biomedicine, smart materials, information and communication technologies, bio-economy and energy efficiency.
Each of these areas requires its own state support policy, assessing available technological specifics, business capacity, as well as scientific potentials.
The most optimal investment solution should be sought through a dialogue with other ministries, research institutions and scientific community, said Latvian minister.
Source: eng/Technology/&doc=88043, 19.02.2014.
For more information see:
= The full report "EU industrial structure report 2013: Competing in Global Value Chains" can be found at: http://ec.europa.eu/enterprise/policies/industrial-competitiveness/competitiveness-analysis/eu-industrial-structure/index_en.htm;
= http://europa.eu/rapid/press-release_IP-14-150_en.htm


 «The Baltic Course» Is Sold and Stays in Business!
