
Analytics, Baltic Export, Foreign trade , Good for Business, Latvia
International Internet Magazine. Baltic States news & analytics
Thursday, 18.06.2026, 11:15
Foreign trade turnover value in Latvia grew by 28.2% in 2011
 Print version
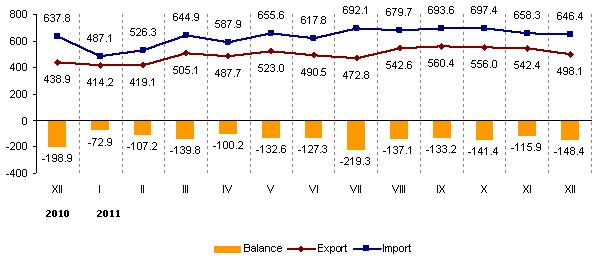
In December 2011 the total foreign trade turnover at current prices comprised LVL 1 144.6 million – 4.7% or LVL 56.1 million less than in the previous month and 6.3% or LVL 67.9 million more than in December 2010.
As compared to the previous month, in December 2011 export value decreased by 8.2% and import value – by 1.8%.Export decline was mostly affected by decrease of LVL 11.9 million or 15.2% in export of base metals and articles of base metals, of LVL 10.1 million or 11.5% in export of wood and articles of wood, and of LVL 9.3 million or 36.2% in export of vegetation products. In its turn, import decline was mostly influenced by decrease of LVL 15.6 million or 22.8% in import of electrical machinery and equipment, as well as of LVL 4.7 million or 4.8% in import of agricultural goods and food products.
 |
| Foreign trade of Latvia, million LVL (1) |
Main commodities in Latvia’s foreign trade in December 2011, at current prices
|
|
Export |
Import |
Foreign trade balance, thousand LVL (+,-) |
|||||
|
thousand LVL |
% of total |
% (+, –) over December 2010
|
thousand LVL |
% of total |
% (+, –) over December 2010 |
|||
|
Total |
498 117 |
100 |
+13.5 |
646 464 |
100 |
+1.4 |
-148 347 |
|
|
Agricultural and food products (I-IV) |
87 764 |
17.6 |
-2.5 |
91 893 |
14.2 |
-0.9 |
-4 129 |
|
|
Live animals and animal products (I) |
24 347 |
4.9 |
+25.1 |
21 199 |
3.3 |
-7.5 |
+3 148 |
|
|
|
meat and offal (02) |
2 234 |
0.4 |
-9.8 |
7 087 |
1.1 |
+3.0 |
-4 853 |
|
|
fish (fresh, frozen, smoked) (03) |
5 262 |
1.1 |
+4.1 |
7 901 |
1.2 |
+6.4 |
-2 639 |
|
|
dairy produce, eggs (04) |
11 884 |
2.4 |
+21.6 |
5 448 |
0.8 |
-21.6 |
+6 436 |
|
Vegetation products (II) |
16 416 |
3.3 |
-49.7 |
22 622 |
3.5 |
-14.2 |
-6 206 |
|
|
|
edible fruit and nuts (08) |
2 672 |
0.5 |
+24.2 |
7 460 |
1.2 |
-4.0 |
-4 788 |
|
|
cereals (10) |
6 181 |
1.2 |
-70.4 |
2 304 |
0.4 |
-63.6 |
+3 877 |
|
|
oilseeds (12) |
3 897 |
0.8 |
-28.8 |
4 804 |
0.7 |
+86.7 |
-907 |
|
Prepared foodstuffs (IV) |
45 220 |
9.1 |
+25.1 |
40 974 |
6.3 |
+5.9 |
+4 246 |
|
|
|
preparations of meat, or fish (16) |
7 267 |
1.5 |
+20.8 |
2 993 |
0.5 |
+16.3 |
+4 274 |
|
|
miscellaneous edible preparations (incl. coffee, tea, etc.)(21) |
1 617 |
0.3 |
+5.8 |
5 842 |
0.9 |
+18.5 |
-4 225 |
|
|
beverages, spirits and vinegar (22) |
23 837 |
4.8 |
+40.3 |
10 404 |
1.6 |
+13.2 |
+13 433 |
|
|
tobacco and manufactured tobacco substitutes (24) |
1 528 |
0.3 |
-26.2 |
2 402 |
0.4 |
-25.4 |
-874 |
|
Mineral products (V) 1) |
41 777 |
8.4 |
+75.1 |
126 349 |
19.5 |
+21.7 |
-84 572 |
|
|
|
mineral fuels, mineral oils and products of their distillation (27) |
38 718 |
7.8 |
+76.6 |
124 240 |
19.2 |
+21.7 |
-85 522 |
|
Products of the chemical and allied industries (VI) |
36 969 |
7.4 |
+14.8 |
66 097 |
10.2 |
+6.0 |
-29 128 |
|
|
|
pharmaceutical products (30) |
17 516 |
3.5 |
-9.3 |
31 939 |
4.9 |
-9.5 |
-14 423 |
|
Plastics and articles thereof; rubber and articles thereof (VII) |
14 162 |
2.8 |
+9.5 |
31 922 |
4.9 |
+31.6 |
-17 760 |
|
|
|
plastics and articles thereof (39) |
11 095 |
2.2 |
+20.1 |
23 706 |
3.7 |
+30.3 |
-12 611 |
|
Wood and articles of wood; wood charcoal; cork and articles of cork; manufactures of straw, of esparto or of other plaiting materials (IX) |
78 109 |
15.7 |
+9.1 |
8 947 |
1.4 |
+12.9 |
+69 162 |
|
|
|
wood and articles of wood; wood charcoal (44) |
78 010 |
15.7 |
+9.0 |
8 910 |
1.4 |
+15.6 |
+69 100 |
|
Pulp of wood or of other fibrous cellulosic material; paper and paperboard and articles thereof (X) |
11 523 |
2.3 |
+24.6 |
15 424 |
2.4 |
+10.3 |
-3 901 |
|
|
|
paper and paperboard; articles of paper pulp, of paper or of paperboard (48) |
6 682 |
1.3 |
+25.6 |
13 923 |
2.2 |
+10.6 |
-7 241 |
|
|
products of the printing industry; manuscripts (49) |
4 467 |
0.9 |
+29.8 |
1 479 |
0.2 |
+9.9 |
+2 988 |
|
Textiles and textile articles (XI) |
18 836 |
3.8 |
+0.2 |
21 800 |
3.4 |
+22.0 |
-2 964 |
|
|
|
knitted or crocheted fabrics (60) |
1 188 |
0.2 |
+28.0 |
1 587 |
0.2 |
+47.0 |
-399 |
|
|
articles of apparel and clothing accessories, knitted or crocheted (61) |
5 114 |
1.0 |
-4.9 |
3 736 |
0.6 |
+15.6 |
+1 378 |
|
|
articles of apparel and clothing accessories, not knitted or crocheted (62) |
6 362 |
1.3 |
+9.7 |
5 941 |
0.9 |
+57.9 |
+421 |
|
Base metals and articles of base metals (XV) |
66 284 |
13.3 |
+1.4 |
63 710 |
9.9 |
+10.3 |
+2 574 |
|
|
|
iron and steel (72) |
39 715 |
8.0 |
-2.3 |
34 346 |
5.3 |
-2.0 |
+5 369 |
|
|
articles of iron or steel (73) |
14 014 |
2.8 |
-1.5 |
15 748 |
2.4 |
+28.6 |
-1 734 |
|
Machinery and mechanical appliances; electrical equipment (XVI) |
70 729 |
14.2 |
+13.5 |
116 096 |
18.0 |
+19.2 |
-45 367 |
|
|
|
machinery and mechanical appliances (84) |
29 759 |
6.0 |
+10.4 |
63 295 |
9.8 |
+29.3 |
-33 536 |
|
|
electrical machinery and equipment (85) |
40 970 |
8.2 |
+15.9 |
52 801 |
8.2 |
+9.0 |
-11 831 |
|
Vehicles, aircraft, vessels and associated transport equipment (XVII) |
39 536 |
7.9 |
+72.4 |
59 521 |
9.2 |
+49.8 |
-19 985 |
|
|
|
vehicles other than railway or tramway rolling stock, and parts and accessories thereof (87) |
30 034 |
6.0 |
+41.5 |
53 979 |
8.3 |
+54.6 |
-23 945 |
|
Miscellaneous manufactured articles (XX) |
13 931 |
2.8 |
+25.7 |
14 886 |
2.3 |
+6.9 |
-955 |
|
|
|
furniture; bedding, mattresses, mattress supports, cushions and similar stuffed furnishings; lamps and lighting fittings (94) |
11 509 |
2.3 |
+29.2 |
9 239 |
1.4 |
+7.7 |
+2 270 |
|
Other goods |
18 497 |
3.7 |
-0.1 |
29 819 |
4.6 |
-71.9 |
-11 322 |
|
______________
¹) This group includes useful minerals, oil and oil products, natural gas and
electricity.
In December 2011,
the most significant share (72.6%) in Latvia’s export had export to the
countries of the European Union, followed by export to the CIS countries –
16.6%. The main export partners were Lithuania (18.3% of total export), Estonia
(14.3%), Russia (11.3%), Germany (7.6%) and Poland (7.4%).
In December 2011, the most significant share in Latvia’s import had import from
the countries of the European Union (77.9%), followed by import from the CIS
countries – 14.9%. The main import partners were Lithuania (19.6% of total
import), Germany (11.8%), Russia (9.7%), Estonia (8.0%) and Poland (7.6%).


 «The Baltic Course» Is Sold and Stays in Business!
