
Analytics, Baltic Export, Foreign trade , Good for Business, Latvia
International Internet Magazine. Baltic States news & analytics
Wednesday, 17.06.2026, 21:51
In January – October foreign trade turnover in Latvia grew by 31.3%
 Print version
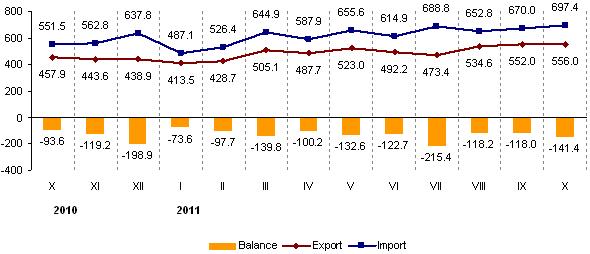
In October 2011 as compared to the previous month, export growth was mostly affected by increase of LVL 15.1 million or 24.4% in export of machinery and mechanical appliances; electrical equipment and of LVL 9.9 million or 21.2% in export of mineral products. Also import growth was mostly influenced by increase of LVL 18.7 million or 14.8% in import of mineral products, as well as by increase of LVL 14.4 million or 78.5% in import of articles of iron or steel.
In January – October 2011 foreign trade turnover value reached LVL 11 192.1 million – 31.3% or LVL 2 668.4 million more than in the corresponding period of the previous year. Of which export value comprised LVL 4 966.3 million – an increase of 30.3% or LVL 1 153.9 million, whereas import value constituted LVL 6 225.8 million – 32.1% or LVL 1 514.5 million more than a year ago.
 |
| Foreign trade of Latvia, million LVL (1) |
1) Data on April, May and July 2011 have been revised.
Main commodities in Latvia’s foreign trade in October 2011, at current prices
|
|
Export |
Import |
Foreign trade balance, thousand LVL (+,-) |
|||||
|
thousand LVL |
% of total |
% (+, -) over October, 2010
|
thousand LVL |
% of total |
% (+, -) over October, 2010
|
|||
|
Total |
556 004 |
100 |
+21.4 |
697 433 |
100 |
+26.5 |
-141 429 |
|
|
Agricultural and food products (I-IV) |
105 040 |
18.9 |
+13.4 |
98 696 |
14.2 |
+15.9 |
+6 344 |
|
|
Live animals and animal products (I) |
24 564 |
4.4 |
+21.3 |
21 982 |
3.2 |
+8.6 |
+2 582 |
|
|
|
meat and offal (02) |
3 627 |
0.7 |
+29.8 |
8 500 |
1.2 |
+36.4 |
-4 873 |
|
|
fish (fresh, frozen, smoked) (03) |
4 582 |
0.8 |
-12.0 |
6 803 |
1.0 |
+1.9 |
-2 221 |
|
|
dairy produce, eggs (04) |
12 575 |
2.3 |
+22.7 |
5 774 |
0.8 |
-14.6 |
+6 801 |
|
Vegetation products (II) |
33 107 |
6.0 |
-7.1 |
27 415 |
3.9 |
+21.5 |
+5 692 |
|
|
|
edible fruit and nuts (08) |
3 195 |
0.6 |
+79.6 |
6 030 |
0.9 |
+18.4 |
-2 835 |
|
|
cereals (10) |
12 652 |
2.3 |
-44.0 |
6 635 |
1.0 |
+23.8 |
+6 017 |
|
|
oilseeds (12) |
11 840 |
2.1 |
+59.3 |
3 797 |
0.5 |
+69.7 |
+8 043 |
|
Prepared foodstuffs (IV) |
45 858 |
8.2 |
+29.7 |
41 043 |
5.9 |
+7.4 |
+4 815 |
|
|
|
preparations of meat, or fish (16) |
6 083 |
1.1 |
+26.1 |
2 980 |
0.4 |
+27.6 |
+3 103 |
|
|
miscellaneous edible preparations (incl. coffee, tea, etc.)(21) |
1 426 |
0.3 |
-9.8 |
5 076 |
0.7 |
-10.9 |
-3 650 |
|
|
beverages, spirits and vinegar (22) |
25 788 |
4.6 |
+35.3 |
9 593 |
1.4 |
+10.8 |
+16 195 |
|
|
tobacco and manufactured tobacco substitutes (24) |
1 225 |
0.2 |
+30.7 |
1 994 |
0.3 |
-9.0 |
-769 |
|
Mineral products (V) 1) |
56 587 |
10.2 |
+2.2 times |
145 510 |
20.9 |
+68.0 |
-88 923 |
|
|
|
mineral fuels, mineral oils and products of their distillation (27) |
52 168 |
9.4 |
+2.3 times |
142 904 |
20.5 |
+68.8 |
-90 736 |
|
Products of the chemical and allied industries (VI) |
39 260 |
7.1 |
+23.4 |
54 669 |
7.8 |
+9.5 |
-15 409 |
|
|
|
pharmaceutical products (30) |
17 769 |
3.2 |
+7.9 |
23 284 |
3.3 |
+12.5 |
-5 515 |
|
Plastics and articles thereof; rubber and articles thereof (VII) |
16 256 |
2.9 |
+10.8 |
33 488 |
4.8 |
+3.5 |
-17 232 |
|
|
|
plastics and articles thereof (39) |
11 744 |
2.1 |
+9.2 |
23 267 |
3.3 |
+2.2 |
-11 523 |
|
Wood and articles of wood; wood charcoal; cork and articles of cork; manufactures of straw, of esparto or of other plaiting materials (IX) |
91 557 |
16.5 |
+12.3 |
11 060 |
1.6 |
+21.7 |
+80 497 |
|
|
|
wood and articles of wood; wood charcoal (44) |
91 502 |
16.5 |
+12.4 |
10 826 |
1.6 |
+21.7 |
+80 676 |
|
Pulp of wood or of other fibrous cellulosic material; paper and paperboard and articles thereof (X) |
12 570 |
2.3 |
+29.6 |
17 455 |
2.5 |
+11.9 |
-4 885 |
|
|
|
paper and paperboard; articles of paper pulp, of paper or of paperboard (48) |
7 506 |
1.3 |
+35.2 |
15 818 |
2.3 |
+13.7 |
-8 312 |
|
|
products of the printing industry; manuscripts (49) |
4 422 |
0.8 |
+17.6 |
1 504 |
0.2 |
-5.7 |
+2 918 |
|
Textiles and textile articles (XI) |
19 969 |
3.6 |
+5.3 |
27 121 |
3.9 |
+0.3 |
-7 152 |
|
|
|
knitted or crocheted fabrics (60) |
1 262 |
0.2 |
-6.9 |
1 811 |
0.3 |
+28.3 |
-549 |
|
|
articles of apparel and clothing accessories, knitted or crocheted (61) |
5 747 |
1.0 |
+15.8 |
6 416 |
0.9 |
-13.0 |
-669 |
|
|
articles of apparel and clothing accessories, not knitted or crocheted (62) |
6 478 |
1.2 |
+12.5 |
6 909 |
1.0 |
-1.1 |
-431 |
|
Base metals and articles of base metals (XV) |
71 448 |
12.9 |
+16.5 |
75 713 |
10.9 |
+14.4 |
-4 265 |
|
|
|
iron and steel (72) |
41 686 |
7.5 |
+20.4 |
29 681 |
4.3 |
-20.2 |
+12 005 |
|
|
articles of iron or steel (73) |
18 193 |
3.3 |
+29.4 |
32 765 |
4.7 |
+2.0 times |
-14 572 |
|
Machinery and mechanical appliances; electrical equipment (XVI) |
77 049 |
13.9 |
+18.1 |
114 657 |
16.4 |
+22.2 |
-37 608 |
|
|
|
machinery and mechanical appliances (84) |
29 657 |
5.3 |
+10.4 |
64 769 |
9.3 |
+59.3 |
-35 112 |
|
|
electrical machinery and equipment (85) |
47 391 |
8.5 |
+23.5 |
49 889 |
7.2 |
-6.1 |
-2 498 |
|
Vehicles, aircraft, vessels and associated transport equipment (XVII) |
31 588 |
5.7 |
+19.2 |
62 512 |
9.0 |
+43.0 |
-30 924 |
|
|
|
vehicles other than railway or tramway rolling stock, and parts and accessories thereof (87) |
28 560 |
5.1 |
+28.8 |
55 660 |
8.0 |
+61.5 |
-27 100 |
|
Miscellaneous manufactured articles (XX) |
14 195 |
2.6 |
+15.4 |
15 460 |
2.2 |
+16.4 |
-1 265 |
|
|
|
furniture; bedding, mattresses, mattress supports, cushions and similar stuffed furnishings; lamps and lighting fittings (94) |
11 400 |
2.1 |
+22.3 |
8 188 |
1.2 |
+8.4 |
+3 212 |
|
Other goods |
20 485 |
3.7 |
+13.6 |
41 092 |
5.9 |
+43.2 |
-20 607 |
|
______________
1) This group includes
useful minerals, oil and oil products, natural gas and electricity.
In October 2011, the most significant share (69.8%) in Latvia’s export had export to the countries of the European Union, followed by export to the CIS countries – 14.7%. The main export partners were Lithuania (16.8% of total export), Estonia (12.2%), Russia (11.5%), Germany (7.7%) and Poland (6.5%).
In October 2011, the most significant share (76.1%) in Latvia’s import had import from the countries of the European Union, followed by import from the CIS countries – 12.7%. The main import partners were Lithuania (19.7% of total import), Germany (12.6%), Poland (8.3%), Russia (7.5%) and Estonia (6.7%).
More information on Latvia’s foreign trade by month and quarter, by country group and commodity group is available in the CSB data base section Foreign trade monthly/quarterly data.


 «The Baltic Course» Is Sold and Stays in Business!
