
Analytics, Baltic Export, Baltic States – CIS, Foreign trade , Good for Business
International Internet Magazine. Baltic States news & analytics
Wednesday, 17.06.2026, 22:16
The trade with Russia influenced the increase of exports as well as imports the most in Estonia
 Print version
In October, exports of goods from Estonia amounted to 1.04 billion euros and imports to Estonia to 1.07 billion euros. In October the annual growth of exports and imports slowed down, one of the reason for which is the gradually improving comparison basis. Faster growth of imports compared to exports increased also the trade deficit. While the trade deficit in October 2010 was 9 million euros, then in October this year it was 35 million euros.
The first place among the destination countries of exports was held by Finland (15% of Estonia’s total exports), followed by Russia (14%) and Sweden (13%). Compared to October of the previous year, exports increased the most to Russia (by 53 million euros or 1.6 times) and decreased by 16% to Sweden. Electrical equipment, wood and articles of wood and furniture were mainly exported to Sweden and Finland, and mechanical equipment and beverages and spirits to Russia.
The largest amounts of goods were imported from Finland (14% of Estonia’s total imports), followed by Latvia and Germany (from both 10%). Imports from Russia also influenced Estonia’s total imports the most. Compared to October of the previous year, the arrivals of goods from Russia increased by more than two times or by 50 million euros. Electrical equipment was mostly imported from Finland, mechanical equipment from Germany and fuels from Latvia and Russia.
The trade surplus was mentioned in Estonia’s trade with the three biggest export destination countries (Finland, Russia and Sweden) or exports to those countries exceeded imports. The biggest trade surplus was registered in trade with Russia (48 million euros).
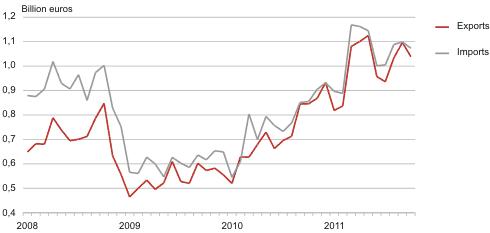 |
| Estonia’s trade by months, 2008–2011 |
In October, the biggest shares in exports were held by machinery and equipment (24% of Estonia’s total exports), mineral products, incl. motor spirits, fuel oils and electricity (15%), and agricultural products and food preparations (11%). The growth of Estonia’s total exports was mostly influenced by the dispatches of mineral products, which grew by 49% compared to October 2010. The growth in exports was also positively influenced by the increase in the dispatches of machinery and equipment (the growth rate 18%). At the same time, dispatches of transport equipment decreased by 21%.
In October the biggest shares of imports were held by machinery and equipment (26% of Estonia’s total imports), mineral products (17%), and agricultural products and food preparations (11%). Similarly to exports, the growth of total imports was also mostly influenced by the arrivals of mineral products, which increased by nearly two times compared to October 2010. The arrivals of machinery and equipment increased by 16%.
In October compared to September, exports of goods decreased by 5% and imports by 2%. The economic sentiment indicator of the Estonian Institute of Economic Research which reflects enterprisers and consumers confidence showed also a small decline in October compared to September (2.9 points). The same indicator slightly improved in November.
Estonia’s trade, January–October, 2010–2011
|
Month |
Exports, million euros |
Imports, million euros |
Balance, million euros |
|||||
|
2010 |
2011 |
change, % |
2010 |
2011 |
change, % |
2010 |
2011 |
|
|
January |
520.0 |
818.5 |
57 |
544.9 |
897.0 |
65 |
-24.9 |
-78.5 |
|
February |
628.4 |
837.0 |
33 |
609.8 |
888.0 |
46 |
18.6 |
-51.0 |
|
March |
627.6 |
1 080.6 |
72 |
804.0 |
1 168.5 |
45 |
-176.4 |
-87.9 |
|
April |
679.8 |
1 100.6 |
62 |
699.2 |
1 162.1 |
66 |
-19.4 |
-61.5 |
|
May |
729.8 |
1 125.1 |
54 |
793.9 |
1 144.7 |
44 |
-64.1 |
-19.6 |
|
June |
662.6 |
957.0 |
44 |
756.7 |
1 001.4 |
32 |
-94.1 |
-44.4 |
|
July |
695.4 |
935.9 |
35 |
732.9 |
1 004.9 |
37 |
-37.5 |
-69.0 |
|
August |
712.7 |
1 033.5 |
45 |
767.1 |
1 088.3 |
42 |
-54.4 |
-54.8 |
|
September |
844.8 |
1 096.7 |
30 |
851.2 |
1 098.5 |
29 |
-6.4 |
-1.8 |
|
October |
845.8 |
1 038.4 |
23 |
855.0 |
1 073.1 |
26 |
-9.2 |
-34.7 |
Main foreign trade partners of Estonia, October 2011
|
Country of destination, |
Exports, |
Share, |
Change compared to |
Country of consignment, |
Imports, |
Share, |
Change compared to |
|
Total |
1 038.4 |
100 |
23 |
Total |
1 073.1 |
100 |
26 |
|
EU27 |
667.6 |
64 |
10 |
EU27 |
863.2 |
80 |
22 |
|
EA17 |
317.8 |
31 |
24 |
EA17 |
388.8 |
36 |
15 |
|
CIS |
166.5 |
16 |
45 |
CIS |
115.9 |
11 |
83 |
|
1. Finland |
155.8 |
15 |
11 |
1. Finland |
151.3 |
14 |
22 |
|
2. Russia |
140.5 |
14 |
61 |
2. Latvia |
110.9 |
10 |
25 |
|
3. Sweden |
131.9 |
13 |
-16 |
3. Germany |
104.2 |
10 |
-4 |
|
4. Latvia |
91.6 |
9 |
23 |
4. Sweden |
100.3 |
9 |
-3 |
|
5. USA |
54.9 |
5 |
138 |
5. Lithuania |
94.8 |
9 |
54 |
|
6. Germany |
53.8 |
5 |
12 |
6. Russia |
92.2 |
9 |
119 |
|
7. Netherlands |
47.6 |
5 |
106 |
7. Poland |
67.8 |
6 |
11 |
|
8. Lithuania |
47.2 |
5 |
6 |
8. United Kingdom |
49.4 |
5 |
152 |
|
9. Norway |
38.1 |
4 |
12 |
9. Netherlands |
36.2 |
3 |
15 |
|
10. Denmark |
28.5 |
3 |
56 |
10. China |
25.1 |
2 |
-11 |
Exports and imports by commodity sections, October 2011
|
Commodity section by Combined Nomenclature (CN) |
Exports |
Imports |
Balance, |
||||
|
million |
share, |
change compared |
million |
share, |
change compared to |
||
|
TOTAL |
1 038.4 |
100 |
23 |
1 073.1 |
100 |
26 |
-34.7 |
|
Agricultural products and food preparations (I–IV) |
111.6 |
11 |
21 |
114.8 |
11 |
23 |
-3.2 |
|
Mineral products (V) |
150.6 |
15 |
49 |
183.7 |
17 |
87 |
-33.1 |
|
Raw materials and products of chemical industry (VI) |
65.6 |
6 |
73 |
84.1 |
8 |
30 |
-18.5 |
|
Articles of plastics and rubber (VII) |
32.7 |
3 |
8 |
56.4 |
5 |
6 |
-23.7 |
|
Wood and products thereof (IX) |
80.2 |
8 |
6 |
22.5 |
2 |
1 |
57.7 |
|
Paper and articles thereof (X) |
28.9 |
3 |
12 |
20.9 |
2 |
0 |
8.0 |
|
Textiles and products thereof (XI) |
26.7 |
2 |
-6 |
47.0 |
4 |
13 |
-20.3 |
|
Metals and products thereof (XV) |
96.3 |
9 |
45 |
90.8 |
9 |
6 |
5.5 |
|
Machinery and equipment (XVI) |
252.8 |
24 |
18 |
280.2 |
26 |
16 |
-27.4 |
|
Transport equipment (XVII) |
48.9 |
5 |
-21 |
83.7 |
8 |
38 |
-34.8 |
|
Miscellaneous manufactured articles (XX) |
71.2 |
7 |
7 |
25.6 |
2 |
25 |
45.6 |
|
Other |
72.9 |
7 |
56 |
63.4 |
6 |
21 |
9.5 |


 «The Baltic Course» Is Sold and Stays in Business!
