
Analytics, Baltic Export, Foreign trade , Good for Business, Lithuania, Markets and Companies
International Internet Magazine. Baltic States news & analytics
Sunday, 02.08.2026, 17:53
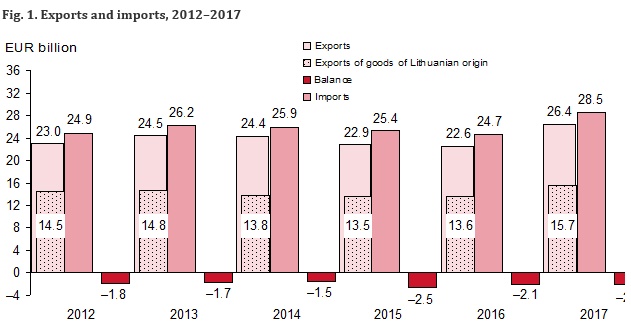
In 2017, exports increased by 16.8%, imports – 15.5% in Lithuania
 Print version
In 2017, against 2016, exports increased by 16.8, imports – 15.5%. The increase in exports was determined by an increase in exports of petroleum products (20.6%) (amount in tonnes decreased by 2.6%), machinery and mechanical appliances, parts thereof (25.9%), electrical machinery and equipment and parts thereof (25.5%). The increase in imports was influenced by an increase in imports of crude petroleum (39.9%) (amount in tonnes increased by 8.8%), ground vehicles (22.1%), machinery and mechanical appliances, parts thereof (16.1%). Mineral products excluded, exports increased by 15.9, imports – 13.9%. Exports of goods of Lithuanian origin increased by 15.4%, mineral products excluded – 12.6%.
In 2017, the most important Lithuania’s partners in exports were Russia (14.8%), Latvia (9.9%), Poland (8.1%) and Germany (7.3%), while in imports – Russia (12.6%), Germany (12.3%), Poland (10.7%) and Latvia (7.2%). Most of the goods of Lithuanian origin were exported to Germany (9.6%), Poland (9%), the United States (7.8%), Latvia (7.5%) and Sweden (7.3%).
In 2017, the largest share in Lithuania’s exports and imports fell within mineral products (14.7 and 19% respectively), machinery and mechanical appliances, electrical equipment (15.8 and 18.5% respectively) and products of the chemical and allied industries (10.1 and 11.7% respectively). As for the goods of Lithuanian origin, the largest share in exports fell within petroleum products (19.7%), miscellaneous manufactured articles (11.4%), prepared foodstuffs, beverages, spirits and tobacco (8.5%), live animals, animal products (7.7%).
Table 1. Foreign trade balance, EUR million
|
|
Exports |
Imports |
Balance |
|
2016 |
22 607.0 |
24 699.6 |
–2 092.6 |
|
I quarter |
5 201.7 |
5 623.3 |
–421.6 |
|
II quarter |
5 535.0 |
6 321.4 |
–786.5 |
|
III quarter |
5 731.1 |
6 179.6 |
–448.5 |
|
IV quarter |
6 139.2 |
6 575.2 |
–436.1 |
|
2017 |
26 410.5 |
28 516.2 |
–2 105.7 |
|
January |
1 882.5 |
2 067.4 |
–184.9 |
|
February |
2 007.7 |
2 191.0 |
–183.3 |
|
March |
2 239.5 |
2 433.2 |
–193.7 |
|
I quarter |
6 129.7 |
6 691.6 |
–561.9 |
|
April |
1 980.5 |
2 300.3 |
–319.8 |
|
May |
2 261.8 |
2 473.1 |
–211.3 |
|
June |
2 263.9 |
2 327.6 |
–63.7 |
|
II quarter |
6 506.2 |
7 101.0 |
–594.8 |
|
July |
2 029.2 |
2 327.9 |
–298.7 |
|
August |
2 238.9 |
2 407.7 |
–168.9 |
|
September |
2 303.8 |
2 417.2 |
–113.3 |
|
III quarter |
6 571.9 |
7 152.8 |
–580.9 |
|
October |
2 357.5 |
2 505.6 |
–148.0 |
|
November |
2 488.7 |
2 648.3 |
–159.5 |
|
December |
2 356.4 |
2416.9 |
–60.5 |
|
IV quarter |
7 202.7 |
7 570.8 |
–368.1 |
|
|||
|
BEC |
Exports |
Imports |
||||
|
Value, EUR million |
Share, % |
Change, against 2016, % |
Value, EUR million |
Share, % |
Change, against 2016, % |
|
|
Total |
26 410.5 |
100.0 |
16.8 |
28 516.2 |
100.0 |
15.5 |
|
Capital goods |
3 552.6 |
13.5 |
31.1 |
4 900.0 |
17.2 |
21.5 |
|
Intermediate goods |
13 345.0 |
50.5 |
15.9 |
15 668.6 |
54.9 |
16.3 |
|
Consumption goods |
7 816.8 |
29.6 |
10.0 |
6 859.9 |
24.1 |
9.2 |
|
Motor spirit |
1 253.3 |
4.7 |
29.1 |
57.2 |
0.2 |
13.2 |
|
Passenger motor cars |
293.2 |
1.1 |
30.8 |
974.4 |
3.4 |
17.1 |
|
Other |
149.7 |
0.6 |
86.1 |
56.0 |
0.2 |
58.1 |
Table 3. Structure
of and changes in trade with key foreign partners1 in 2017
|
|
Exports |
|
Imports |
|||||
|
Value, EUR million |
Share, % |
Share of goods of Lithuanian origin, % |
Change, against 2016, % |
Value, EUR million |
Share, % |
Change, against 2016, % |
||
Total |
26 410.5 |
100.0 |
59.4 |
16.8 |
Total |
28 516.2 |
100.0 |
15.5 |
|
EU28 |
15
409.3 |
58.3 |
69.6 |
12.3 |
EU28 |
20
143.9 |
70.6 |
14.8 |
|
Euro area |
9
729.5 |
36.8 |
65.9 |
14.4 |
Euro area |
13
612.0 |
47.7 |
14.4 |
|
Russia |
3
919.6 |
14.8 |
7.8 |
28.7 |
Russia |
3
589.5 |
12.6 |
4.6 |
|
Latvia |
2
624.3 |
9.9 |
44.6 |
17.6 |
Germany |
3
507.8 |
12.3 |
15.9 |
|
Poland |
2
148.9 |
8.1 |
65.7 |
4.5 |
Poland |
3
058.9 |
10.7 |
14.0 |
|
Germany |
1
933.8 |
7.3 |
77.8 |
11.4 |
Latvia |
2
049.4 |
7.2 |
3.1 |
|
United States |
1
374.5 |
5.2 |
89.1 |
18.2 |
Italy |
1
484.3 |
5.2 |
10.1 |
|
Estonia |
1
307.7 |
5.0 |
48.4 |
9.2 |
Netherlands |
1
442.4 |
5.1 |
20.2 |
|
Sweden |
1
267.9 |
4.8 |
89.8 |
18.1 |
Sweden |
1
101.2 |
3.9 |
3.4 |
|
Belarus |
1
004.9 |
3.8 |
13.8 |
15.4 |
France |
1
086.2 |
3.8 |
28.2 |
|
United Kingdom |
930.2 |
3.5 |
85.7 |
–3.3 |
United Kingdom |
937.4 |
3.3 |
38.6 |
|
Netherlands |
928.2 |
3.5 |
82.5 |
31.2 |
Belgium |
931.8 |
3.3 |
18.8 |
|
Norway |
748.5 |
2.8 |
89.5 |
8.7 |
Estonia |
918.7 |
3.2 |
11.0 |
|
Ukraine |
736.0 |
2.8 |
74.6 |
20.6 |
Kazakhstan |
894.5 |
3.1 |
3
times |
|
Denmark |
673.1 |
2.5 |
81.8 |
12.5 |
China |
822.9 |
2.9 |
16.1 |
|
France |
661.9 |
2.5 |
84.2 |
5.9 |
Finland |
744.0 |
2.6 |
20.4 |
|
Italy |
604.2 |
2.3 |
81.9 |
13.9 |
Belarus |
657.3 |
2.3 |
–5.8 |
|
Other |
5
546.8 |
21.2 |
68.2 |
23.0 |
Other |
5
289.9 |
18.5 |
17.7 |
_______________
1 Partner country: in case of exports – recipient country; in case of imports in trade with the EU countries – country of consignment, in trade with the non-EU countries – country of origin of the good.
Table 4. Commodity structure of and changes in exports in 2017
|
CN sections, chapters |
Value, EUR million |
Share, % |
Share of goods
of Lithuanian origin, % |
Change, against 2016, % |
|
|
|
Total |
26 410.5 |
100.0 |
59.4 |
16.8 |
|
XVI |
Machinery and
mechanical appliances; electrical equipment; parts thereof; sound recorders
and reproducers, television image and sound recorders and reproducers, and
parts and accessories of such articles |
4 164.3 |
15.8 |
26.0 |
25.7 |
|
84 |
Machinery and mechanical appliances;
parts thereof |
2 327.4 |
8.8 |
16.4 |
25.9 |
|
V |
Mineral products |
3 875.4 |
14.7 |
85.5 |
22.7 |
|
27 |
Mineral
fuels, mineral oils and products of their distillation; bituminous
substances; mineral waxes |
3 837.5 |
14.5 |
85.6 |
22.8 |
|
2710 |
Petroleum products |
3 459.2 |
13.1 |
89.5 |
20.6 |
|
VI |
Products of the
chemical or allied industries |
2 665.8 |
10.1 |
41.7 |
8.0 |
|
31 |
Fertilisers |
714.9 |
2.7 |
85.5 |
3.9 |
|
XX |
Miscellaneous
manufactured articles |
2107.8 |
8.0 |
85.0 |
11.0 |
|
94 |
Furniture
and related articles, lamps and lighting fittings, prefabricated buildings |
1 939.0 |
7.3 |
89.4 |
11.1 |
|
IV |
Prepared
foodstuffs; beverages, spirits and vinegar; tobacco and manufactured tobacco
substitutes |
1 915.9 |
7.3 |
69.8 |
13.4 |
|
24 |
Tobacco and manufactured tobacco
substitutes |
500.2 |
1.9 |
97.4 |
29.8 |
|
VII |
Plastics
and articles thereof; rubber and articles thereof |
1 707.1 |
6.5 |
68.3 |
14.5 |
|
39 |
Plastics and articles thereof |
1 579.8 |
6.0 |
72.9 |
15.1 |
|
XV |
Base metals and articles of base metal |
1 537.1 |
5.8 |
52.3 |
30.8 |
|
73 |
Articles of iron or steel |
650.8 |
2.5 |
64.1 |
20.5 |
|
II |
Vegetable products |
1491.4 |
5.6 |
64.4 |
2.3 |
|
10 |
Cereals |
614.2 |
2.3 |
93.9 |
3.5 |
|
|
Other |
6 945.7 |
26.2 |
59.4 |
16.6 |
Table 5. Commodity
structure of and changes in exports of goods of Lithuanian origin in 2017
|
CN sections, chapters |
Value, EUR million |
Share, % |
Change, against
the respective period of 2016, % |
|
|
|
Total |
15 692.2 |
100.0 |
15.4 |
|
V |
Mineral products |
3 312.8 |
21.1 |
27.5 |
|
27 |
Mineral
fuels, mineral oils and products of their distillation; bituminous
substances; mineral waxes |
3 283.6 |
20.9 |
27.6 |
|
2710 |
Petroleum products |
3 096.9 |
19.7 |
26.9 |
|
XX |
Miscellaneous
manufactured articles |
1 792.1 |
11.4 |
10.8 |
|
94 |
Furniture
and related articles, lamps and lighting fittings, prefabricated buildings |
1 734.0 |
11.0 |
11.7 |
|
IV |
Prepared
foodstuffs; beverages, spirits and vinegar; tobacco and manufactured tobacco
substitutes |
1 337.7 |
8.5 |
12.8 |
|
24 |
Tobacco and manufactured tobacco
substitutes |
487.2 |
3.1 |
27.8 |
|
I |
Live animals; animal products |
1 210.4 |
7.7 |
18.8 |
|
04 |
Dairy produce; birds’ eggs; natural
honey; edible products of animal origin, not elsewhere specified or included |
527.0 |
3.4 |
26.9 |
|
VII |
Plastics
and articles thereof; rubber and articles thereof |
1 166.6 |
7.4 |
13.3 |
|
39 |
Plastics and articles thereof |
1 152.1 |
7.3 |
13.4 |
|
VI |
Products of the
chemical or allied industries |
1 112.9 |
7.1 |
5.1 |
|
31 |
Fertilisers |
611.5 |
3.9 |
4.7 |
|
XVI |
Machinery and
mechanical appliances; electrical equipment; parts thereof; sound recorders
and reproducers, television image and sound recorders and reproducers, and
parts and accessories of such articles |
1 081.8 |
6.9 |
25.0 |
|
85 |
Electrical machinery and equipment and
parts thereof; sound recorders and reproducers |
699.4 |
4.5 |
32.0 |
|
|
Other |
4 677.9 |
29.9 |
10.9 |
Table 6. Commodity
structure of and changes in imports in 2017
|
CN sections, chapters |
Value, EUR million |
Share, % |
Change, against
the respective period of 2016, % |
|
|
|
Total |
28 516.2 |
100.0 |
15.5 |
|
V |
Mineral products |
5 420.7 |
19.0 |
22.4 |
|
27 |
Mineral
fuels, mineral oils and products of their distillation; bituminous
substances; mineral waxes |
5 176.3 |
18.2 |
23.9 |
|
2709 |
Crude petroleum |
3 429.6 |
12.0 |
39.9 |
|
XVI |
Machinery
and mechanical appliances; electrical equipment; parts thereof; sound
recorders and reproducers, television image and sound recorders and
reproducers, and parts and accessories of such articles |
5 271.0 |
18.5 |
16.3 |
|
84 |
Machinery
and mechanical appliances; parts thereof |
3 027.6 |
10.6 |
16.1 |
|
VI |
Products
of the chemical or allied industries |
3 322.8 |
11.7 |
12.0 |
|
30 |
Pharmaceutical products |
1 012.6 |
3.6 |
5.6 |
|
XVII |
Vehicles,
aircraft, vessels and associated transport equipment |
2 726.3 |
9.6 |
18.2 |
|
87 |
Vehicles other than railway or tramway
rolling stock, and parts and accessories thereof |
2 625.7 |
9.2 |
22.1 |
|
XV |
Base metals and
articles of base metal |
1 862.9 |
6.5 |
24.1 |
|
72 |
Iron and steel |
622.9 |
2.2 |
32.1 |
|
VII |
Plastics
and articles thereof; rubber and articles thereof |
1 604.9 |
5.6 |
15.1 |
|
39 |
Plastics and articles thereof |
1 334.3 |
4.7 |
16.0 |
|
IV |
Prepared foodstuffs;
beverages, spirits and vinegar; tobacco and manufactured tobacco substitutes |
1 514.3 |
5.3 |
9.0 |
|
22 |
Beverages, spirits and vinegar |
419.4 |
1.5 |
17.2 |
|
|
Other |
6 793.3 |
23.8 |
9.9 |
|
Period |
Exports |
Exports of goods of Lithuanian origin |
Imports |
Balance |
||||
|
value, EUR million |
change, against the previous month, % |
value, EUR million |
change, against the previous month, % |
Share in total exports, % |
value, EUR million |
change, against the previous month, % |
EUR million |
|
|
2016-12 |
2 024.0 |
−2.9 |
1 186.1 |
–7.4 |
58.6 |
2 259.7 |
6.8 |
−235.8 |
|
2017-01 |
1 882.5 |
−7.0 |
1 201.8 |
1.3 |
63.8 |
2 067.4 |
−8.5 |
−184.9 |
|
2017-02 |
2 007.7 |
6.7 |
1 217.6 |
1.3 |
60.6 |
2 191.0 |
6.0 |
−183.3 |
|
2017-03 |
2 239.5 |
11.5 |
1 301.4 |
6.9 |
58.1 |
2 433.2 |
11.1 |
−193.7 |
|
2017-04 |
1 980.5 |
−11.6 |
1 134.4 |
−12.8 |
57.3 |
2 300.3 |
−5.5 |
−319.8 |
|
2017-05 |
2 261.8 |
14.2 |
1 312.5 |
15.7 |
58.0 |
2 473.1 |
7.5 |
−211.3 |
|
2017-06 |
2 263.9 |
0.1 |
1 340.7 |
2.1 |
59.2 |
2 327.6 |
−5.9 |
−63.7 |
|
2017-07 |
2 029.2 |
−10.4 |
1 162.4 |
−13.3 |
57.3 |
2 327.9 |
0.0 |
−298.7 |
|
2017-08 |
2 238.9 |
10.3 |
1 324.3 |
13.9 |
59.2 |
2 407.7 |
3.4 |
−168.9 |
|
2017-09 |
2 303.8 |
2.9 |
1 429.2 |
7.9 |
62.0 |
2 417.2 |
0.4 |
−113.3 |
|
2017-10 |
2 357.5 |
2.3 |
1 387.8 |
−2.9 |
58.9 |
2 505.6 |
3.7 |
−148.0 |
|
2017-11 |
2 488.7 |
5.6 |
1 489.2 |
7.3 |
59.8 |
2 648.3 |
5.7 |
−159.5 |
|
2017-12 |
2 356.4 |
−5.3 |
1 390.7 |
−6.6 |
59.0 |
2 416.9 |
-8.7 |
−60.5 |
Note. Due to rounding, the sum of lines or columns in some tables may disagree with the “Total”.
For more information, see the Database of Indicators.


 «The Baltic Course» Is Sold and Stays in Business!
