
Analytics, Baltic Export, Estonia, Foreign trade , Good for Business, Markets and Companies
International Internet Magazine. Baltic States news & analytics
Friday, 26.04.2024, 11:02
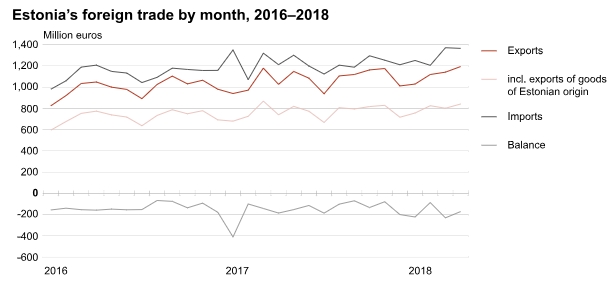
In April, the exports increased by 16% and imports by 13% in Estonia
 Print version
In April 2018, exports from Estonia amounted to 1.2 billion euros and
imports to Estonia to 1.4 billion euros at current prices. The trade
deficit was 171 million euros (in April 2017, it was 185 million euros).
In March, the top
destination countries of Estonia’s exports were Finland (16% of Estonia’s total
exports), Sweden (12%) and Latvia (10%). Electrical equipment and base metals
and articles of base metal were the main commodities exported to Finland;
electrical equipment and miscellaneous manufactured articles (prefabricated
wood buildings, furniture) were the main commodities exported to Sweden;
mineral products (motor spirit, electricity) and transport equipment (motor
cars) were the main commodities exported to Latvia. The biggest increase
occurred in exports to Finland (up by 34 million euros), Latvia (up by 33
million euros) and the USA (up by 19 million euros). In exports to
Finland, the exports of electrical equipment and wood and articles of wood
increased. There was also an increase in the exports of mineral products and
transport equipment to Latvia and electrical equipment to the USA. The biggest
decrease occurred in exports to Sweden (down by 16 million euros).
In April, the
biggest share in the exports of goods was held by electrical equipment (15% of
the total exports of goods), followed by mineral products (13%), and wood and
articles of wood (11%). The greatest increase was in the exports of mineral
products (up by 50 million euros), mechanical appliances (up by 25 million
euros) and transport equipment (up by 21 million euros). The growth in the
exports of mineral products was mainly due to increased export quantities
(motor spirit up by 51% and electricity up by 31%), compared to the same period
of the previous year.
The share of goods
of Estonian origin in total exports was 70% in April 2018. The exports of goods
of Estonian origin increased by 14% and re-exports by 23%. Increased exports in
the commodity sections of mineral products, wood and articles of wood and
mechanical appliances contributed to the increase in the exports of goods of
Estonian origin. Among the main destination countries, the exports of goods of
Estonian origin had the highest share (over 90%) in exports to the Netherlands,
Denmark, Sweden and Norway.
The main countries
of consignment in April were Finland (14% share of Estonia’s total imports),
Germany (11%) and Sweden (10%). The main commodities imported were: mineral
products and metals and articles of base metal from Finland; mechanical
appliances and transport equipment from Germany; and electrical equipment and
transport equipment from Sweden. The biggest increase occurred in imports from
Finland (up by 42 million euros), Belarus (up by 33 million euros,
i.e. approximately 8 times) and Sweden (up by 26 million euros). Mineral
products (motor spirit, fuel additives) were imported more from Finland and
Belarus, electrical equipment from Sweden. Imports decreased the most from
Poland (down by 25 million euros) and Turkey (down by 21 million euros), with
less transport equipment imported.
The main
commodities imported to Estonia were electrical equipment (15% of Estonia’s
total imports of goods), mineral products (13%), mechanical appliances and
transport equipment (both 11%). The greatest increase was in the imports of
mineral products (up by 67 million euros), mechanical appliances (up by 30
million euros) and electrical equipment (up by 21 million euros).
Increased imports of mineral products were due to higher import quantities
(imports of fuel additives increased by approximately 4 times and imports of
motor spirit by 31%), compared to the same period of the previous year.
In April, the greatest decrease occurred in the imports of transport equipment
(down by 48 million euros).
In April 2018, the foreign trade export volume index
increased by 16% and the import volume index by 12% compared to April 2017.
|
Estonia’s foreign trade by month, 2017–2018 |
|||||||||||||||
|
Month |
Exports, million euros |
Imports, million euros |
Balance, million euros |
|
|||||||||||
|
2017 |
2018 |
change, % |
2017 |
2018 |
change, % |
2017 |
2018 |
|
|||||||
|
I quarter |
4,117 |
4,483 |
9 |
4,954 |
5,193 |
5 |
-837 |
-710 |
|
||||||
|
January |
940 |
1,029 |
9 |
1,350 |
1,251 |
-7 |
-410 |
-222 |
|
||||||
|
February |
972 |
1,119 |
15 |
1,072 |
1,205 |
12 |
-100 |
-86 |
|
||||||
|
March |
1,179 |
1,141 |
-3 |
1,321 |
1,371 |
4 |
-142 |
-230 |
|
||||||
|
April |
1,027 |
1,194 |
16 |
1,212 |
1,365 |
13 |
-185 |
-171 |
|
||||||
|
Main foreign trade partners of Estonia, April 2018 |
|
||||||||||||||
|
Country of
destination, group of countries |
Exports, million euros |
Share, % |
Change on
same month of previous year, % |
Country of
consignment, group of countries |
Imports, million euros |
Share, % |
Change on
same month of previous year, % |
|
|||||||
|
TOTAL |
1,194 |
100 |
16 |
TOTAL |
1,365 |
100 |
13 |
|
|||||||
|
EU-28 |
826 |
69 |
12 |
EU-28 |
1,096 |
80 |
11 |
|
|||||||
|
Euro area 19 |
583 |
49 |
19 |
Euro area 19 |
790 |
58 |
13 |
|
|||||||
|
Non-EU |
369 |
31 |
27 |
Non-EU |
269 |
20 |
19 |
|
|||||||
|
1. Finland |
195 |
16 |
21 |
1. Finland |
196 |
14 |
27 |
|
|||||||
|
2. Sweden |
137 |
12 |
-10 |
2. Germany |
156 |
11 |
20 |
|
|||||||
|
3. Latvia |
122 |
10 |
37 |
3. Sweden |
131 |
10 |
25 |
|
|||||||
|
4. Germany |
82 |
7 |
15 |
4. Lithuania |
117 |
9 |
6 |
|
|||||||
|
5. Russia |
82 |
7 |
3 |
5. Latvia |
116 |
8 |
19 |
|
|||||||
|
6. Lithuania |
68 |
6 |
19 |
6. Russia |
94 |
7 |
13 |
|
|||||||
|
7. USA |
53 |
4 |
54 |
7. Poland |
84 |
6 |
-23 |
|
|||||||
|
8. Norway |
51 |
4 |
24 |
8. Netherlands |
78 |
6 |
-1 |
|
|||||||
|
9. Netherlands |
41 |
3 |
6 |
9. China |
45 |
3 |
-3 |
|
|||||||
|
10. Denmark |
33 |
3 |
9 |
10. Belarus |
37 |
3 |
- |
|
|||||||
|
|||||||||||||||
|
Exports and imports by commodity section, April 2018 |
||||||||
|
Commodity section (chapter) by Combined Nomenclature (CN) |
Exports |
Imports |
Balance, million euros |
|
||||
|
million euros |
share, % |
change on
same period of previous year, % |
million euros |
share,% |
change on
same period of previous year, % |
|
||
|
TOTAL |
1,194 |
100 |
16 |
1,365 |
100 |
13 |
-171 |
|
|
Agricultural
products and food preparations (I–IV) |
93 |
8 |
14 |
129 |
10 |
9 |
-36 |
|
|
Mineral products (V) |
154 |
13 |
48 |
181 |
13 |
59 |
-27 |
|
|
Raw
materials and products of chemical industry (VI) |
62 |
5 |
9 |
115 |
9 |
15 |
-54 |
|
|
Articles
of plastics and rubber (VII) |
37 |
3 |
15 |
73 |
5 |
19 |
-36 |
|
|
Wood and
articles of wood (IX) |
130 |
11 |
16 |
53 |
4 |
33 |
77 |
|
|
Paper and
articles thereof (X) |
32 |
3 |
17 |
24 |
2 |
15 |
8 |
|
|
Textiles and
textile articles (XI) |
34 |
3 |
6 |
53 |
4 |
2 |
-19 |
|
|
Base
metals and articles of base metal (XV) |
107 |
9 |
11 |
121 |
9 |
17 |
-14 |
|
|
Mechanical appliances (84) |
110 |
9 |
29 |
155 |
11 |
24 |
-45 |
|
|
Electrical equipment (85) |
177 |
15 |
-2 |
202 |
15 |
11 |
-24 |
|
|
Transport equipment (XVII) |
84 |
7 |
33 |
150 |
11 |
-24 |
-66 |
|
|
Optical,
measuring, precision instruments (XVIII) |
34 |
3 |
19 |
31 |
2 |
12 |
3 |
|
|
Miscellaneous manufactured articles (XX) |
106 |
9 |
13 |
32 |
2 |
7 |
74 |
|
|
Other |
36 |
2 |
10 |
48 |
3 |
16 |
-12 |
|
The statistics are based on the questionnaires “Intrastat” and “Exports
(sale of fish and crustaceans in foreign waters and ports)”, the due dates of
which were, respectively, 14 and 15 May 2018, and on the customs declaration
data of the Estonian Tax and Customs Board, which were sent to Statistics
Estonia on 20 May 2018. Statistics Estonia published the monthly summary of
foreign trade in 15 working days. In the case of the statistical activity
“Foreign trade”, the main representative of public interest is the Ministry of
Economic Affairs and Communications, commissioned by whom Statistics Estonia
collects and analyses the data necessary for conducting the statistical
activity.


 «The Baltic Course» Is Sold and Stays in Business!
