
Analytics, Baltic Export, Foreign trade , Good for Business, Latvia, Markets and Companies
International Internet Magazine. Baltic States news & analytics
Wednesday, 25.03.2026, 03:05
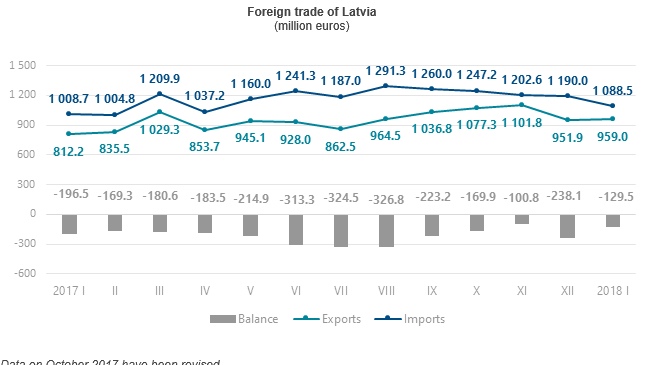
In January, foreign trade turnover in Latvia was 12.4% larger y-o-y
 Print version
Compared to January 2017, foreign trade balance has improved as exports in total foreign trade amount increased from 44.6% to 46.8%.
Calendar and seasonally adjusted data at current prices show that, compared to January 2017, in January 2018 the exports value at current prices went up by 19.2% and the imports value by 8.3%, whereas, compared to the previous month, the exports value increased by 5.8%, but the imports value reduced by 0.1%.
Main changes in exports in January 2018, compared to January 2017:
- exports of machinery and
mechanical appliances; electrical equipment up by EUR 58.2 mill. or
42.7%,
- exports of basic metals and articles of basic metals up by
EUR 27.1 mill. or 42.3%,
- exports of wood and articles of wood up by EUR 14.0 mill. or 9.4%,
- exports of mineral products up by EUR 13.2 mill. or 34.6%,
- exports of prepared foodstuffs up by EUR 11.6 mill. or 17.8%.
Main changes in imports in January 2018, compared to January 2017:
- imports of machinery and
mechanical appliances; electrical equipment up by EUR 64.4 mill. or
32.0%,
- imports of basic metals and articles of basic metals up by
EUR 29.6 mill. or 39.6%,
- imports of prepared foodstuffs up by EUR 17.0 mill. or 22.6%,
- imports of mineral products down by EUR 19.3 mill. or 18.5%,
- imports of vehicles, aircraft, vessels and associated transport equipment down
by EUR 14.5 mill. or 15.0%.
In January, the main export partners of Latvia in trade with EU countries were Lithuania (15.7% of total exports), Estonia (11.2%), Germany (7.3%) and Sweden (6.9%), whereas the main import partners were Lithuania (18.0% of total imports), Germany (10.1%), Poland (9.5%) and Estonia (7.9%).
Foreign trade of Latvia in January 2018 by country group (at current prices)
|
|
Exports |
Imports |
||||
|
|
mill. EUR |
% of total |
changes as %, compared to January 2017 |
mill. EUR |
% of total |
changes as %, compared to January 2017 |
|
Total |
959.0 |
100 |
18.1 |
1 088.5 |
100 |
7.9 |
|
European
Union countries |
687.2 |
71.7 |
10.3 |
810.1 |
74.4 |
8.8 |
|
euro area countries |
462.4 |
48.2 |
10.3 |
600.0 |
55.1 |
7.8 |
|
CIS
countries |
88.7 |
9.3 |
9.9 |
117.6 |
10.8 |
4.5 |
|
other
countries |
183.1 |
19.0 |
69.2 |
160.8 |
14.8 |
6.1 |
Russia was the main partner in
trade with third countries; its share in total Latvian exports in January
accounted for 6.1%, whereas in imports – for 7.3%.
Main commodities in exports of
Latvia in January 2018 (at current
prices)
|
|
Thou. EUR |
As % of total |
Changes as %, compared to |
||
|
January 2017 |
December 2017 |
average of
previous 12 months |
|||
|
Total |
958 955 |
100 |
18.1 |
0.7 |
1.0 |
|
wood and articles of wood; wood charcoal |
162 926 |
17.0 |
9.4 |
15.8 |
4.0 |
|
electrical
machinery and equipment |
102 296 |
10.7 |
9.3 |
-1.7 |
-1.1 |
|
machinery
and mechanical appliances |
92 316 |
9.6 |
2.2 times |
29.7 |
49.2 |
|
vehicles other than railway or tramway rolling stock, and parts and
accessories thereof |
51 425 |
5.4 |
14.3 |
-5.2 |
-1.8 |
|
mineral fuels, mineral oils and products of their distillation |
47 148 |
4.9 |
32.6 |
-6.2 |
16.4 |
|
iron and
steel |
38 817 |
4.0 |
73.5 |
64.5 |
9.0 |
|
cereals |
38 654 |
4.0 |
1.5 |
-15.2 |
13.1 |
|
beverages,
spirits and vinegar |
34 354 |
3.6 |
24.3 |
-41.1 |
-29.7 |
|
articles of iron and steel |
33 221 |
3.5 |
29.9 |
26.2 |
6.8 |
|
pharmaceutical
products |
28 776 |
3.0 |
-7.3 |
-33.0 |
-20.3 |
The rise in the exports of
machinery and mechanical appliances in January 2018, as compared to
January 2017, was facilitated by an increase in the exports of turbojets,
turbopropellers and other gas turbines by EUR 41.5 mill. In turn,
exports of pharmaceutical products dropped as exports of medicaments decreased
by EUR 3.5 mill. or 12.1%.
Main commodities in imports of
Latvia in January 2018 (at current
prices)
|
|
Thou. EUR |
As% of total |
Changes as%,
compared to |
||
|
January 2017 |
December 2017 |
average of
previous 12 months |
|||
|
Total |
1 088 476 |
100 |
7.9 |
-8.5 |
-7.0 |
|
electrical
machinery and equipment |
148 194 |
13.6 |
24.5 |
5.2 |
15.5 |
|
machinery
and mechanical appliances |
117 274 |
10.8 |
42.9 |
-23.4 |
-0.3 |
|
vehicles other than railway or tramway rolling stock, and parts and
accessories thereof |
81 018 |
7.4 |
2.3 |
-28.9 |
-19.6 |
|
mineral fuels, mineral oils and products of their distillation |
80 114 |
7.4 |
-19.9 |
-8.2 |
-24.2 |
|
iron and
steel |
54 075 |
5.0 |
45.3 |
0.8 |
27.4 |
|
pharmaceutical
products |
50 651 |
4.7 |
8.4 |
-1.4 |
-0.1 |
|
plastics
and articles thereof |
45 453 |
4.2 |
9.4 |
-0.4 |
-9.2 |
|
wood and articles of wood; wood charcoal |
41 461 |
3.8 |
25.9 |
8.8 |
9.1 |
|
beverages,
spirits and vinegar |
32 032 |
2.9 |
29.4 |
-27.2 |
-28.0 |
|
articles of iron and steel |
27 341 |
2.5 |
45.3 |
-6.9 |
-0.6 |
Rise of imports of iron and steel in January 2018, as compared to January 2017, was mostly affected by the increase in imports of flat rolled products of iron and non-alloy steel of EUR 10.0 mill. or 49 1%. In turn, a drop was experienced in the imports of mineral fuels, mineral oils and products of their distillation, as the imports of natural gas in gaseous state dropped by EUR 22.4 mill. or 66.8%.
More information on the foreign trade of Latvia by month and quarter, as well as by country group and commodity group is available in the Foreign trade section of the CSB database.


 «The Baltic Course» Is Sold and Stays in Business!
