
Analytics, Baltic Export, Foreign trade , Good for Business, Latvia, Markets and Companies
International Internet Magazine. Baltic States news & analytics
Saturday, 27.04.2024, 05:47
In September, foreign trade turnover in Latvia gone up by 13.3%
 Print version
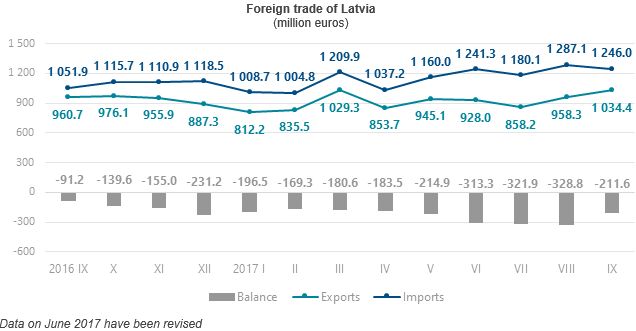
In September,
Latvia exported goods in the amount of EUR 1.03 billion, and imported
goods in the amount of EUR 1.25 billion. The foreign trade balance
worsened, as exports in the total foreign trade value dropped to 45.4% (in
September 2016 – 47.7%).
Over the first
nine months of the present year, the foreign trade turnover of Latvia at
current prices reached EUR 18.63 billion – EUR 2.19 billion
or 13.3% more than in the corresponding period of 2016. The exports value
constituted EUR 8.25 billion (an increase of EUR 716.0 million
or 9.5%), whereas the imports value comprised EUR 10.38 billion (an
upturn of EUR 1.47 billion or 16.5%).
Calendar and
seasonally adjusted data at current prices show that, compared to
September 2016, in September 2017 the exports value at current prices
went up by 10.3% and the imports value by 22.5%, whereas, compared to the
previous month, the exports value grew by 0.5% and the imports value by 0.1%.
Main changes in exports in
September 2017, compared to September 2016:
-
exports of machinery and mechanical appliances; electrical equipment up by EUR
50.4 mln or 32.4%;
- exports of prepared foodstuffs up by EUR
20.9 mln or 25.7%;
- exports of base metals and articles of
base metals up by EUR 15.5 mln or 21.1%;
- exports of mineral products up by EUR
7.0 mln or 16.1%;
- exports of vegetable products down by EUR
8.7 mln or 7.8%.
Main changes in imports in
September 2017, compared to September 2016:
-
imports of mineral products up by EUR 68.2 mln or 73.7%;
- imports of machinery and mechanical
appliances; electrical equipment up by EUR 44.8 mln or 21.4%;
- imports of prepared foodstuffs up by EUR
24.6 mln or 25.6%;
- imports of products of the chemical and
allied industries up by EUR 21.9 mln or 22.3%;
- imports of vehicles, aircraft, vessels
and associated transport equipment up by EUR 13.9 mln or 12.9%.
In September,
Lithuania (with 16.2% of the total exports), Estonia (10.6%), Germany (7.1%)
and United Kingdom (5.1%) were the main export partners of Latvia in trade with
the EU countries, and Lithuania (with 17.2% of the total imports), Germany
(10.8%), Poland (8.7%) and Estonia (7.1%) were the main import partners.
Foreign trade of Latvia in September 2017 by country group (at current prices)
|
|
Exports |
Imports |
||||
|
|
mln EUR |
as% of
total |
changes as %, compared to SEP 2016 |
mln EUR |
as % of
total |
changes as %, compared to SEP 2016 |
|
Total |
1 034.4 |
100 |
7.7 |
1 246.0 |
100 |
18.4 |
|
European
Union countries |
704.3 |
68.1 |
-2.9 |
938.9 |
75.4 |
8.3 |
|
Euro area
countries |
496.4 |
48.0 |
-1.4 |
697.7 |
56.0 |
11.4 |
|
CIS
countries |
126.2 |
12.2 |
16.9 |
166.5 |
13.4 |
72.0 |
|
Other
countries |
203.9 |
19.7 |
59.6 |
140.6 |
11.2 |
58.7 |
Russia was the
main partner in trade with the third countries; in September, its share
accounted for 8.9% in the total Latvian exports and for 10.5% in the total
Latvian imports.
Main commodities in exports of Latvia in September 2017 (at current prices)
|
|
Exports |
Imports |
||||
|
|
mln EUR |
as % of
total |
changes as %, compared to SEP 2016 |
mln EUR |
as % of
total |
changes as %, compared to SEP 2016 |
|
Total |
1 034.4 |
100 |
7.7 |
1 246.0 |
100 |
18.4 |
|
European
Union countries |
704.3 |
68.1 |
-2.9 |
938.9 |
75.4 |
8.3 |
|
Euro area
countries |
496.4 |
48.0 |
-1.4 |
697.7 |
56.0 |
11.4 |
|
CIS
countries |
126.2 |
12.2 |
16.9 |
166.5 |
13.4 |
72.0 |
|
Other
countries |
203.9 |
19.7 |
59.6 |
140.6 |
11.2 |
58.7 |
Russia was the
main partner in trade with the third countries; in September, its share
accounted for 8.9% in the total Latvian exports and for 10.5% in the total
Latvian imports.
Main commodities in imports of Latvia in September 2017 (at current prices)
|
|
thsd EUR |
|
Changes as %, compared to |
||
|
September
2016 |
August
2017 |
average of
previous 12 months |
|||
|
Total |
1 245 952 |
100 |
18.4 |
-3.2 |
10.5 |
|
mineral fuels, mineral oils and products of their distillation |
155 380 |
12.5 |
75.9 |
18.7 |
52.3 |
|
electrical
machinery and equipment |
130 257 |
10.5 |
12.7 |
-1.6 |
2.3 |
|
machinery
and mechanical appliances |
124 244 |
10.0 |
32.0 |
-14.7 |
15.3 |
|
vehicles other than railway or tramway rolling stock, and parts and
accessories thereof |
99 730 |
8.0 |
1.8 |
14.7 |
4.6 |
|
beverages,
spirits and vinegar |
59 065 |
4.7 |
40.1 |
-10.5 |
48.9 |
|
pharmaceutical
products |
53 003 |
4.3 |
27.2 |
-1.5 |
10.8 |
|
plastics
and articles thereof |
51 309 |
4.1 |
14.8 |
-1.9 |
8.6 |
|
iron and
steel |
39 807 |
3.2 |
-3.3 |
5.7 |
-4.1 |
|
wood and wood products; wood charcoal |
38 800 |
3.1 |
14.7 |
-3.3 |
6.1 |
|
articles of iron or steel |
29 099 |
2.3 |
19.0 |
9.6 |
16.5 |
In
September 2017, compared to September 2016, growth in imports of
mineral fuels, mineral oils and products of their distillation was influenced
by the increase of EUR 62.5 million (7.8 times) in imports of
natural gas (gaseous). Meanwhile, decline in the imports of iron and steel was
mainly affected by the drop of EUR 8.3 million or 32.8% in imports of
flat-rolled products of iron or non-alloy steel.
More information
on foreign trade of Latvia in breakdown by month and quarter, as well as by
country group and commodity group is available in the CSB database
section Foreign Trade.


 «The Baltic Course» Is Sold and Stays in Business!
