
Analytics, Baltic Export, Baltic States – CIS, EU – Baltic States, Good for Business, Latvia
International Internet Magazine. Baltic States news & analytics
Friday, 26.04.2024, 10:01
In October, exports value in Latvia rose by 2.8%
 Print version
Foreign trade balance slightly improved as exports in total foreign trade value increased to 47.9% (in September 2015 – 47.2%).
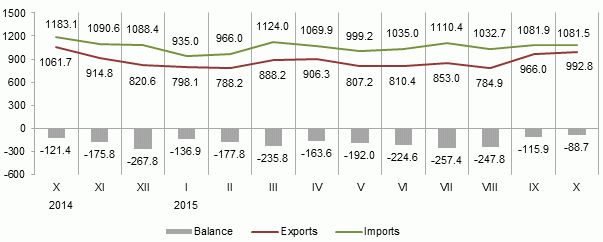 |
| Latvia’s foreign trade, mln euros |
Data source: Central Statistical Bureau of Latvia
Notes: data on January and July 2015 have been revised
Main changes in exports in October, compared to September:
· exports of wood and articles of wood grew by 18.6 mln euros or 12.9%,
· exports of machinery and mechanical appliances; electrical equipment rose by 17.3 mln euros or 12.4%,
· exports of prepared foodstuffs rose by 12.2 mln euros or 16.5%,
· exports of basic metals and articles of basic metals fell by 8.7 mln euros or 9.8%,
· exports of vegetable products decreased by 8.3 mln euros or 5.9%.
Main changes in imports in October, compared to September:
· imports of products of the chemical and allied industries declined by 24.2 mln euros or 19.7%,
· imports of basic metals and articles of basic metals dropped by 6.8 mln euros or 7.9%,
· imports of prepared foodstuffs reduced by 6.2 mln euros or 6.4%,
· imports of machinery and mechanical appliances; electrical equipment grew by 32.3 mln euros or 15.1%,
· imports of vehicles, aircraft, vessels and associated transport equipment increased by 7.0 mln euros or 7.6%.
In October main export partners in trade with the EU countries were Lithuania (17.3% of total export), Estonia (10.1%), Germany (7.3%) and Poland (6.1%); main import partners were Lithuania (17.0% of total import), Germany (11.9%), Poland (10.8%) and Estonia (8.0%).
Foreign trade of Latvia by country group in October 2015, at current prices
|
|
Exports |
Imports |
||||
|
|
mln euros |
% of total |
Changes over September 2015 |
mln euros |
% of total |
Changes over September 2015 |
|
Total |
992.8 |
100 |
2.8 |
1 081.5 |
100 |
-0.04 |
|
Member States of the European Union |
734.2 |
73.9 |
5.5 |
849.2 |
78.5 |
-2.3 |
|
Euro area countries |
507.8 |
51.1 |
5.0 |
614.4 |
56.8 |
-2.0 |
|
CIS countries |
115.8 |
11.7 |
9.5 |
133.4 |
12.3 |
13.9 |
|
Other countries |
142.8 |
14.4 |
-12.9 |
98.9 |
9.2 |
3.4 |
Main partner in trade with third countries was Russia, share of which in total exports of Latvia in October comprised 8.3 %, but in imports – 9.6 %.
Changes of main commodities in Latvia’s exports in October 2015, at current prices
|
|
thsd euros |
% of total |
Changes as % over |
||
|
October 2014 |
September 2015 |
average of previous 12 months |
|||
|
Total |
992 846 |
100 |
-6.5 |
2.8 |
14.6 |
|
wood and wood products; wood charcoal |
162 712 |
16.4 |
9.0 |
12.9 |
13.5 |
|
electrical machinery and equipment |
104 957 |
10.6 |
-15.2 |
23.6 |
-4.8 |
|
mineral fuels, mineral oils and products of their distillation |
68 532 |
6.9 |
-24.2 |
5.2 |
11.4 |
|
cereals |
59 241 |
6.0 |
-29.2 |
-32.9 |
2.1 times |
|
machinery and mechanical appliances |
52 563 |
5.3 |
1.0 |
-4.9 |
2.6 |
|
oil seeds, oleaginous fruits, industrial or medicinal plants |
50 565 |
5.1 |
7.9 times |
46.2 |
7.8 times |
|
beverages, spirits and vinegar |
48 881 |
4.9 |
-37.5 |
24.9 |
31.1 |
|
articles of iron and steel |
35 683 |
3.6 |
4.6 |
7.6 |
27.4 |
|
vehicles other than railway or tramway |
34 470 |
3.5 |
-24.2 |
-16.8 |
-8.7 |
|
iron and steel |
28 342 |
2.9 |
-10.3 |
-29.3 |
-9.2 |
|
pharmaceutical products |
26 900 |
2.7 |
7.0 |
-2.4 |
0.9 |
Increase in exports of oil seeds, oleaginous fruits, industrial or medicinal plants in October 2015, as compared to October 2014 was affected by growth in exports of rape and colza seeds of 35.7 mln euros or 7.7 times. But exports of beverages, spirits and vinegar reduced as exports of spirits dropped by 21.6 mln euros or 35.8 %.
Changes of main commodities in Latvia’s imports in October 2015, at current prices
|
|
thsd euros |
% of total |
Changes as % over |
||
|
October 2014 |
September 2015 |
average of previous 12 months |
|||
|
Total |
1 081 535 |
100 |
-8.6 |
-0.04 |
2.1 |
|
electrical machinery and equipment |
139 958 |
12.9 |
-4.0 |
24.9 |
7.2 |
|
mineral fuels, mineral oils and products of their distillation |
120 513 |
11.1 |
-32.1 |
0.8 |
-7.1 |
|
machinery and mechanical appliances |
106 332 |
9.8 |
10.0 |
4.3 |
5.9 |
|
vehicles other than railway or tramway |
86 659 |
8.0 |
7.4 |
6.5 |
14.7 |
|
plastics and articles thereof |
42 337 |
3.9 |
-11.9 |
-0.2 |
-2.6 |
|
pharmaceutical products |
35 246 |
3.3 |
-6.4 |
-34.7 |
-18.0 |
|
beverages, spirits and vinegar |
34 070 |
3.2 |
-25.5 |
-9.7 |
19.3 |
|
wood and wood products; wood charcoal |
32 843 |
3.0 |
3.4 |
8.4 |
7.2 |
|
iron and steel |
31 489 |
2.9 |
-27.3 |
-9.6 |
-16.7 |
Increase of imports of machinery and mechanical appliances; electrical equipment in October 2015, as compared to October 2014, was affected by the increase in imports of various machinery for lifting, transportation, loading and unloading by 2.5 mln euros or 2.9 times. In turn, drop in imports of mineral fuels, mineral oils and products of their distillation was mostly influenced by decrease in imports of diesel oil of 26.4 mln euros or 28.7%.
More information on foreign trade of Latvia by month and quarter, by country group and commodity group is available in the CSB data base section Foreign Trade.


 «The Baltic Course» Is Sold and Stays in Business!
