
Analytics, Baltic Export, Baltic States – CIS, EU – Baltic States, Foreign trade , Good for Business, Latvia
International Internet Magazine. Baltic States news & analytics
Friday, 26.04.2024, 18:32
Foreign trade turnover witnessed 3.8% growth in Latvia in June
 Print version
Nevertheless foreign trade balance worsened, since exports in total foreign trade value declined to 43.8% (in May 2015 – 44.7%).
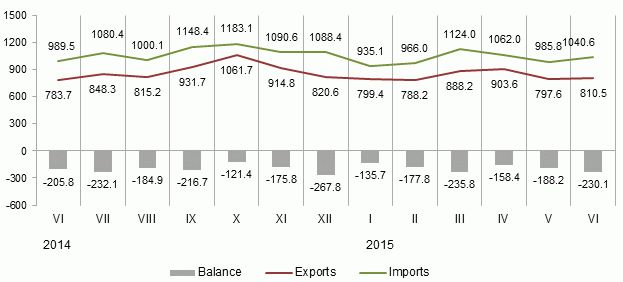 |
| Latvia’s foreign trade, mln euros (1) |
Data source: Central Statistical Bureau of Latvia
Main changes in exports in June, compared to May:
· exports of wood and articles of wood grew by 13.1 mln euros or 9.5%,
· exports of products of the chemical and allied industries increased by 9.4 mln euros or 17.3%,
· exports of optical instruments and apparatus (including medical); clocks and watches, musical instruments grew by 6.8 mln euros or 43.4%.
· exports of prepared foodstuffs rose by 6.5 mln euros or 11.6%,
· exports of basic metals and articles of basic metals dropped by 15.0 mln euros or 16.7%.
Main changes in imports in June, compared to May:
· imports of vehicles and associated transport equipment increased by 23.1 mln euros or 36.7%,
· imports of plastics and articles thereof grew by 7.0 mln euros or 12.0%,
· imports of machinery and mechanical appliances; electrical equipment increased by 6.6 mln euros or 3.0%,
· imports of prepared foodstuffs rose by 6.2 mln euros or 8.2%.
Affected by seasonal factors, in June as compared to May both – exports (of 9.9 mln euros or 31.5%) and imports (of 4.0 mln euros or 31.5%) of vegetable products witnessed decrease.
In June main export partners in trade with the EU Member States were Lithuania (18.8% of total export), Estonia (11.9%), Germany (6.7%) and Sweden (6.2%); main import partners – Lithuania (18.5% of total import), Poland (11.3%), Germany (11.1%) and Estonia (7.8%).
Foreign trade of Latvia by country group in June 2015, at current prices
|
|
Exports |
Imports |
||||
|
|
mln euros |
% of total |
% (+, –) over May 2015 |
mln euros |
% of total |
% (+, –) over May 2015 |
|
Total |
810.5 |
100 |
+1.6 |
1 040.6 |
100 |
+5.6 |
|
Member States of the European Union |
593.0 |
73.2 |
+1.6 |
840.8 |
80.8 |
+6.1 |
|
Euro area countries |
398.6 |
49.2 |
+1.1 |
611.1 |
58.7 |
+6.1 |
|
CIS countries |
106.5 |
13.1 |
+15.6 |
110.2 |
10.6 |
+4.0 |
|
Other countries |
111.0 |
13.7 |
-9.0 |
89.6 |
8.6 |
+2.6 |
Growth in exports to the CIS countries was mainly affected by increase in exports to Uzbekistan of 4.2 mln euros or 2.8 times (growth in exports of products of the chemical and allied industries – 3.5 mln euros or 4 times), as well as to Kazakhstan – of 2.2 mln euros or 84.9% (growth in exports of agricultural and food products – 1.1 mln euros or 2.2 times).
The main partner in trade with third countries was Russia, the share of which in total Latvian exports in June accounted for 8.7%, and in imports – for 7.2%. Compared to May exports value in June 2015 grew by 2.9 mln euros or 4.4%, and imports value – by 8.2 mln euros or 12.4%. Compared to June 2014 exports value dropped by 16.7 mln euros or 19.3%, in turn imports value grew by 4.0 mln euros or 5.6%.
Changes of main commodities in Latvia’s exports in June 2015, at current prices
|
|
thsd euros |
% of total |
% (+, –) over |
||
|
June 2014 |
May 2015 |
average of previous 12 months |
|||
|
Total |
810 479 |
100 |
+3.4 |
+1.6 |
-6.1 |
|
wood and wood products; wood charcoal |
150 985 |
18.6 |
+9.3 |
+9.5 |
+5.6 |
|
electrical machinery and equipment |
96 533 |
11.9 |
+9.6 |
-7.4 |
-12.2 |
|
mineral fuels, mineral oils and products of their distillation |
55 783 |
6.9 |
+1.3 |
+2.1 |
-14.1 |
|
machinery and mechanical appliances |
49 641 |
6.1 |
+9.7 |
-3.4 |
+3.2 |
|
iron and steel |
32 483 |
4.0 |
+5.5 |
-30.4 |
+5.7 |
|
vehicles other than railway or tramway |
30 596 |
3.8 |
-22.7 |
+11.1 |
-18.3 |
|
pharmaceutical products |
29 201 |
3.6 |
+17.6 |
+24.3 |
+13.4 |
|
articles of iron and steel |
27 477 |
3.4 |
-6.4 |
-6.7 |
-2.5 |
|
furniture, other furnishing articles; prefabricated buildings |
24 956 |
3.1 |
+24.1 |
+13.0 |
+13.3 |
|
beverages, spirits and vinegar |
24 947 |
3.1 |
-18.4 |
+18.6 |
-38.5 |
|
plastics and articles thereof |
22 202 |
2.7 |
+3.4 |
+3.9 |
+5.8 |
In June 2015, compared to June 2014, rise in exports of furniture, other furnishing articles; prefabricated buildings was affected by increase in exports of prefabricated buildings of 2.6 mln euros or 59.2%. In turn, decline in exports of passenger cars of 10.2 mln euros or 59.2% significantly influenced the total exports of vehicles other than railway or tramway rolling stock, and parts and accessories thereof.
Changes of main commodities in Latvia’s imports in June 2015, at current prices
|
|
thsd euros |
% of total |
% (+, –) over |
||
|
June 2014 |
May 2015 |
average of previous 12 months |
|||
|
Total |
1 040 552 |
100 |
+5.2 |
+5.6 |
-1.3 |
|
electrical machinery and equipment |
131 609 |
12.6 |
+27.8 |
+0.8 |
-0.5 |
|
mineral fuels, mineral oils and products of their distillation |
113 822 |
10.9 |
-15.4 |
+5.1 |
-16.2 |
|
machinery and mechanical appliances |
98 021 |
9.4 |
+14.0 |
+6.0 |
+4.7 |
|
vehicles other than railway or tramway |
75 442 |
7.3 |
+3.6 |
+24.4 |
+6.4 |
|
plastics and articles thereof |
49 041 |
4.7 |
+13.8 |
+8.8 |
+12.4 |
|
pharmaceutical products |
46 627 |
4.5 |
+22.3 |
-3.7 |
+11.7 |
|
iron and steel |
38 921 |
3.7 |
+1.3 |
-3.3 |
+1.9 |
|
wood and wood products; wood charcoal |
31 304 |
3.0 |
+11.6 |
+0.2 |
+6.9 |
|
beverages, spirits and vinegar |
26 657 |
2.6 |
+15.1 |
-2.2 |
-6.0 |
Rise in imports of electrical machinery and equipment in June 2015, as compared to June 2014, was affected by increase in imports of machines for the reception, conversion and transmission or regeneration of voice, images or other data of 5.7 mln euros or 2.4 times. In turn, drop in imports of mineral fuels, mineral oils and products of their distillation was mostly influenced by decrease in imports of diesel oil of 13.7 mln euros or 18.2%.
More information on foreign trade of Latvia by month and quarter, by country group and commodity group is available in the CSB data base section Foreign Trade.
1Data on March 2015 have been revised.


 «The Baltic Course» Is Sold and Stays in Business!
