
Analytics, Baltic Export, Baltic States – CIS, EU – Baltic States, Foreign trade , Good for Business, Latvia
International Internet Magazine. Baltic States news & analytics
Saturday, 27.04.2024, 05:19
Exports in Latvia grew by 12.2% and imports by 14.2% in March
 Print version
In March, Latvia exported goods in amount of 864.7 mln euros, but imported – in amount of 1 057.2 mln euros. Foreign trade balance slightly worsened as exports in total foreign trade value declined to 45.0% (in February 2015 – 45.4%).
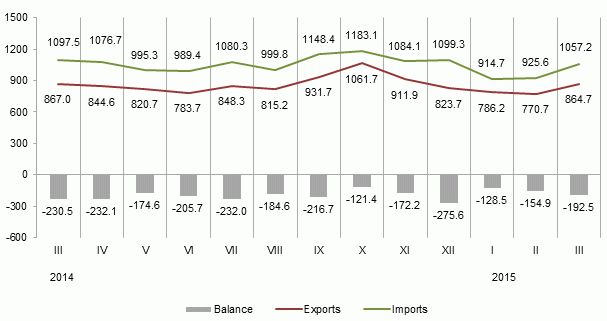 |
| Latvia’s foreign trade, in mln euros (1) |
Data source: Central Statistical Bureau of Latvia
Main changes in exports in March, compared to February:
· exports of wood and articles of wood grew by 34.0 mln euros or 25.2%,
· exports of textiles and textile articles increased by 15.9 mln euros or 59.1%,
· exports of products of the chemical and allied industries grew by 15.2 mln euros or 29.8%,
· exports of basic metals and articles of basic metals grew by 13.6 mln euros or 22.7%,
· exports of machinery and mechanical appliances; electrical equipment reduced by 32.4 mln euros or 18.9%.
Main changes in imports in March, compared to February:
· imports of products of the chemical and allied industries grew by 31.5 mln euros or 31.3%,
· imports of mineral products rose by 20.9 mln euros or 20.7%,
· imports of vehicles and associated transport equipment increased by 18.3 mln euros or 26.0%,
· imports of textiles and textile articles increased by 15.6 mln euros or 39.2%,
· imports of basic metals and articles of basic metals dropped by 10.3 mln euros or 11.3%.
In March, main export partners were Lithuania (18.1% of total export), Estonia (11.7%), Poland (7.4%), and Germany (6.5%), but main import partners were Lithuania (16.7% of total import), Poland (11.6%), Germany (11.5%) and Estonia (8.1%).
Foreign trade of Latvia by country groups in March 2015, at current prices
|
|
Exports |
Imports |
||||
|
mln euros |
% of total |
in % (+, –) over February 2015 |
mln euros |
% of total |
% (+, –) over February 2015 |
|
|
Total |
864.7 |
100 |
+12.2 |
1 057.2 |
100 |
+14.2 |
|
Member States of the European Union |
668.0 |
77.3 |
+18.0 |
858.6 |
81.2 |
+21.8 |
|
Euro area countries |
427.9 |
49.5 |
+14.2 |
617.5 |
58.4 |
+23.3 |
|
CIS countries |
87.4 |
10.1 |
-11.5 |
109.5 |
10.4 |
-13.4 |
|
Other countries |
109.3 |
12.6 |
+3.5 |
89.1 |
8.4 |
-5.6 |
The main partner in trade with third countries was Russia, share of which in total Latvian exports in March accounted for 6.6%, but in imports – 7.7%.
Changes of main commodities in Latvia’s exports in March 2015, at current prices
|
|
thsd euros |
% of total |
% (+, –) over |
||
|
March 2014 |
February 2015 |
average of previous 12 months |
|||
|
Total |
864 737 |
100 |
-0.3 |
+12.2 |
+1.1 |
|
wood and wood products; wood charcoal |
168 846 |
19.5 |
+12.2 |
+25.2 |
+19.2 |
|
electrical machinery and equipment |
94 704 |
11.0 |
-0.5 |
-25.1 |
-10.0 |
|
mineral fuels, mineral oils and products of their distillation |
61 741 |
7.1 |
-6.3 |
+5.7 |
-7.4 |
|
machinery and mechanical appliances |
44 500 |
5.1 |
+10.4 |
-1.3 |
-2.3 |
|
vehicles other than railway or tramway |
41 624 |
4.8 |
-4.1 |
+39.3 |
+8.8 |
|
pharmaceutical products |
29 503 |
3.4 |
-1.9 |
+10.2 |
+13.7 |
|
articles of iron and steel |
28 748 |
3.3 |
+10.6 |
+14.3 |
+1.4 |
|
iron and steel |
26 442 |
3.1 |
-13.5 |
+46.2 |
-14.5 |
|
beverages, spirits and vinegar |
22 711 |
2.6 |
-24.4 |
-1.9 |
-46.6 |
|
plastics and articles thereof |
22 459 |
2.6 |
+20.4 |
+21.7 |
+11.1 |
|
furniture, other furnishing articles; prefabricated buildings |
20 901 |
2.4 |
+2.4 |
-15.4 |
-4.4 |
Rise of exports of plastics and articles thereof in March 2015, as compared to March 2014, was affected by the increase in exports of plates, sheets, foil of plastics and other articles thereof by 2.1 mln euros or 52.6%. But exports of beverages, spirits and vinegar reduced as exports of spirits dropped by 5.2 mln euros or 24.2%.
Changes of main commodities in Latvia’s imports in March 2015, at current prices
|
|
thsd euros |
% of total |
% (+, –) over |
||
|
March 2014 |
February 2015 |
average of previous 12 months |
|||
|
Total |
1 057 190 |
100 |
-3.7 |
+14.2 |
+0.7 |
|
mineral fuels, mineral oils and products of their distillation |
117 743 |
11.1 |
-16.6 |
+22.8 |
-16.7 |
|
electrical machinery and equipment |
110 629 |
10.5 |
+1.1 |
-3.4 |
-11.1 |
|
machinery and mechanical appliances |
94 985 |
9.0 |
-1.4 |
+21.8 |
+2.9 |
|
vehicles other than railway or tramway |
83 312 |
7.9 |
+7.6 |
+32.0 |
+16.8 |
|
pharmaceutical products |
51 103 |
4.8 |
+5.6 |
+24.2 |
+24.5 |
|
plastics and articles thereof |
45 877 |
4.3 |
-3.1 |
+20.5 |
+6.0 |
|
iron and steel |
31 366 |
3.0 |
-24.4 |
-39.2 |
-18.4 |
|
wood and wood products; wood charcoal |
30 877 |
2.9 |
+20.0 |
+8.3 |
+8.8 |
Rise in imports of wood and wood products; wood charcoal in March 2015, as compared to March 2014, was affected by the increase in imports of round timber of 2.6 mln euros or 45.8%. In turn, decline in imports of iron and steel by 12.6 mln euros or by 45.6% significantly influenced drop in imports of flat-rolled products of iron or non-alloy steel.
More information on Latvia’s foreign trade by months and quarters by country groups and commodity groups can be obtained in the CSB data base section "Foreign trade".
1 Data on September, October and December 2014 have been revised.


 «The Baltic Course» Is Sold and Stays in Business!
