
Analytics, Economics, GDP, Latvia, Markets and Companies
International Internet Magazine. Baltic States news & analytics
Friday, 26.04.2024, 14:24
GDP of Latvia increased by 0.5% in Q3
 Print version
According to seasonally unadjusted data, compared to the 3rd quarter of 2013, the GDP in the 3rd quarter of 2014 grew by 2.4%.
In the 3rd quarter of 2014 gross domestic product at current prices is 6.3 bln euro.
Data source: Central Statistical Bureau of
Latvia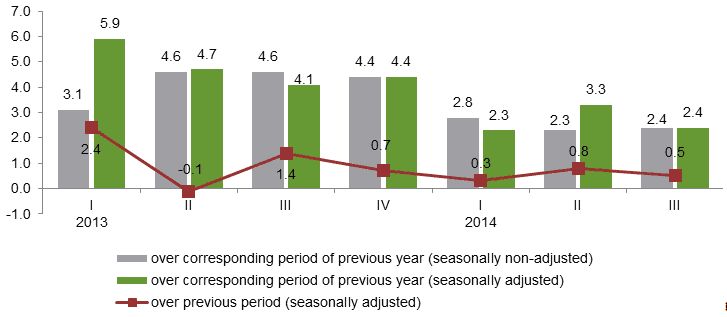
Changes of GDP volume, 1st quarter 2013 – 3rd quarter 2014 (at constant prices, %)
Production approach (seasonally non-adjusted data)
In the 3rd quarter of 2014, as compared to the 3rd quarter of 2013, manufacturing rate has dropped by 0.6%, which was affected by 0.3% decrease in manufacture of food products, 5.3% reduction in manufacture of non-metallic mineral products, as well as by 21.5% drop in repair and installation of machinery and equipment. Manufacturing was positively affected by production volume growth in wood and of products of wood subsector by 8.7% and in manufacture of fabricated metal products – by 7.5%.
Construction of residential buildings increased by 24.4% and construction and repair of educational buildings grew 2.1 time. Construction of local pipelines and communication lines rose by 50.1%. Construction of streets and roads decreased by 11.2% and construction of main pipelines, communication and power lines – by 26.1%.
Retail trade grew by 3.4%, of which retail sale of automotive fuel – by 2.6%. There was 4.3% increase in trade of food products and 2.9% increase – in trade of non-food products.
Increase in transport sector was promoted by turnover growth in road transport activity: by 4% – in freight transport and by 6% – in passenger transport.
Financial services have risen by 9%.
In accommodation and food service activities there was an increase of 3.8% and 2.1%. Activity of travel agencies has gone up by 5%.
Rise in entertainment and recreation sector comprised 3%, but in gambling and betting sector – 6%.
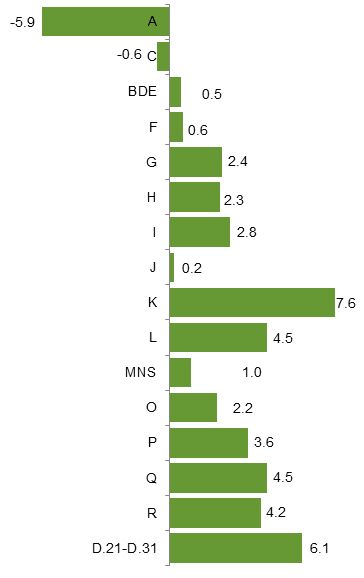 |
| Changes of GDP in the 3rd quarter of 2014 by kind of economic activity, at constant prices, % over 3rd quarter of 2013 |
Data source: Central statistical Bureau of Latvia
|
NACE Rev. 2 activities |
||
|
agriculture, forestry and fishing (A) |
4.0 |
|
|
manufacturing (C) |
12.0 |
|
|
other industry (BDE) |
3.4 |
|
|
construction (F) |
8.3 |
|
|
trade (G) |
14.9 |
|
|
transportation and storage (H) |
9.6 |
|
|
accommodation and food service activities (I) |
2.1 |
|
|
information and communication (J) |
4.6 |
|
|
financial and insurance activities (K) |
4.2 |
|
|
real estate activities (L) |
12.3 |
|
|
commercial services (MNS) |
8.9 |
|
|
public administration and defence; compulsory social security (O) |
6.6 |
|
|
education (P) |
4.3 |
|
|
human health and social work activities (Q) |
2.7 |
|
|
arts, entertainment and recreation (R) |
2.1 |
|
|
(D.21-D.31) taxes on products minus subsidies on products |
x |
|
Expenditure approach (seasonally non-adjusted data)
In the 3rd quarter of 2014, compared to the 3rd quarter of 2013, private final consumption at current prices grew by 3.1%. Households' expenditure on food rose by 4.5%, but expenditure on housing – by 0.5%. Households' expenditure on transport reduced by 1.1% (expenditure on public transport, purchase and exploitation of transport vehicle). Gross fixed capital formation increased by 0.8%. Export of goods increased by 2.6%, but export of services – reduced by 5.7%. Import of goods went up by 0.1%, while import of services – dropped by 2.8%.
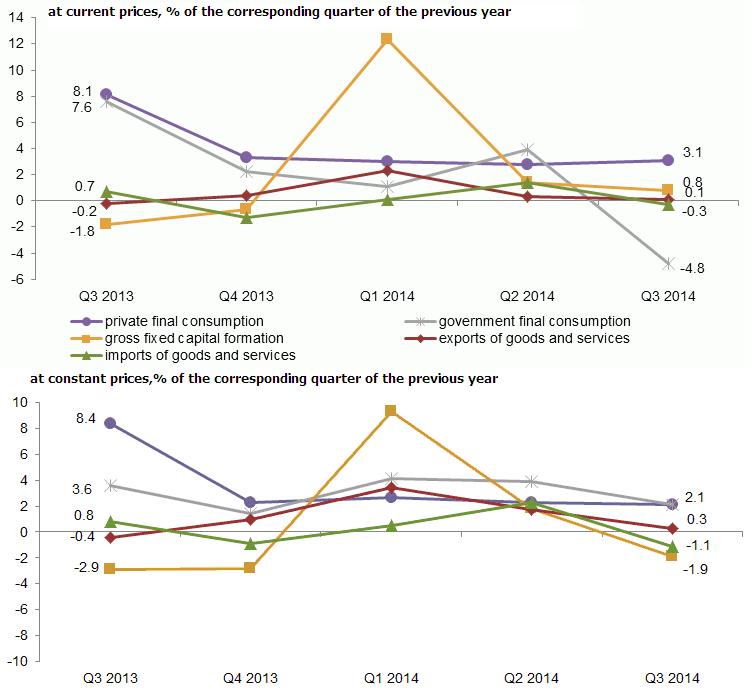 |
| Gross domestic product by main expenditure items |
Data source: Central Statistical Bureau of Latvia
Compared to the 3rd quarter of 2013, private final consumption in the 3rd quarter of 2014 at constant prices grew by 2.1%, of which expenditure on food – by 4.5%. Expenditure on housing reduced by 0.6%, but expenditure on transport – by 1.4%.
Expenditure on gross fixed capital formation reduced by 1.9%. It was affected by drop of investment in public administration sector by 27.1% and in transportation and storage sector – by 6.1%. However, investment in electricity, gas, steam and air conditioning sector, as well as in manufacturing rose by 0.6% and 33.4%, respectively.
Export of goods increased by 3.2%, but export of services – reduced by 6.4%. Import of goods dropped by 0.5%, while import of services – by 4%.
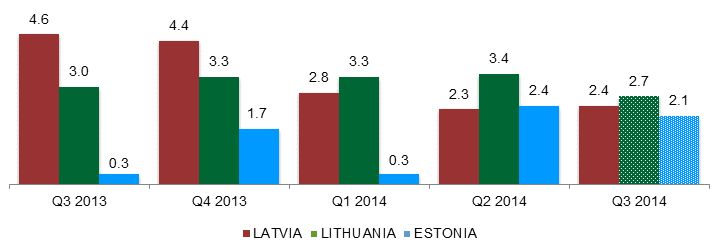 |
| Changes of Gross Domestic Product in the Baltic Countries (seasonally non-adjusted data, at constant prices, % of the corresponding period of the previous year) |
*Flash estimate data on the 3rd quarter of 2014
Possible changes in calculations of government sector, balance of payments and sectors of financial services, as well as services producer price indices will be taken into account in GDP calculations and balancing of quarterly national accounts. More information on these indicators will be available in the CSB database on 85th day after the reference quarter – on 23 December.
Detailed information on time series is published in the CSB database in section Gross domestic product.


 «The Baltic Course» Is Sold and Stays in Business!
