
Analytics, Employment, EU – Baltic States, Financial Services, Labour-market, Latvia, Wages
International Internet Magazine. Baltic States news & analytics
Friday, 26.04.2024, 21:45
Employment level slightly increases during the year 2014 in Latvia
 Print version
The share of women in the total number of employed persons was slightly higher than of men – 50.1% and 49.9%, respectively.
Due to the decrease in the number of population, also the number of employed persons declined (by 3.4 thsd compared to the previous quarter). It mostly affected the administrative and support service activities, real estate activities, finance and insurance, manufacturing, and accommodation and food services sector.
In the 3rd quarter of 2014 the share of employed young people aged 15 – 24 kept increasing, and 69.5 thsd or 33% of the population of this age group were employed. A year ago 30.2%, and in the 2nd quarter of 2014 – 30.9% of the young people were employed.
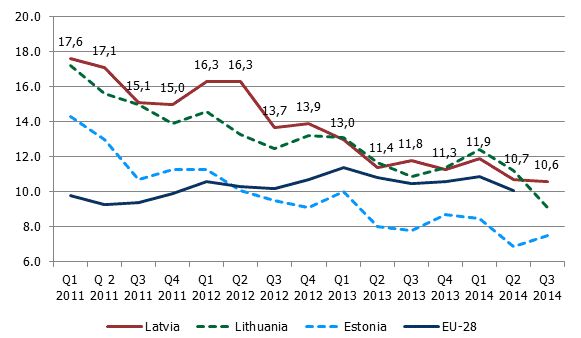 |
| Employment rate in the Baltic States and the European Union, in % |
Data source: Eurostat database, for data on the 3rd quarter of 2014 – Labour Force Survey in Latvia, Lithuania and Estonia
Within the framework of the Labour Force Survey information on wages and salaries was also acquired. Over the year the share of employees receiving wages and salaries of up to EUR 285 after taxes decreased by 10.1 percentage points, while the share of employees receiving wages and salaries from EUR 285 to 450 increased by 6.3 percentage points.
Employees by monthly net (after taxes) wages and salaries in the main job, in %
|
|
3rd quarter of 2013 |
2nd quarter of 2014 |
3rd quarter of 2014 |
|
Employees |
100.0 |
100.0 |
100.0 |
|
Up to EUR 285.00 |
27.9 |
18.6 |
17.8 |
|
EUR 285.01 – 450.00 |
28.4 |
34.9 |
34.7 |
|
EUR 450.01 – 700.00 |
24.7 |
27.3 |
28.0 |
|
EUR 700.01 – 1400.00 |
11.7 |
12.7 |
14.1 |
|
EUR 1400.01 and more |
1.9 |
2.3 |
1.5 |
|
Was not calculated or paid |
2.5 |
2.2 |
1.9 |
|
Not specified |
2.9 |
2.0 |
2.0 |
In the 3rd quarter of 2014 the Labour Force Survey covered 4.7 thsd households, interviewing 7.8 thsd persons aged 15-74.
More information on the Labour Force Survey results and methodology is available in the section Employment and Unemployment.
For the methodology of the Labour Force Survey visit the section Methodology.


 «The Baltic Course» Is Sold and Stays in Business!
