
Analytics, Education and Science, Employment, Labour-market, Lithuania, Markets and Companies
International Internet Magazine. Baltic States news & analytics
Monday, 29.06.2026, 20:50
In Q2, the unemployment rate in Lithuania decreased to 11.2%
 Print version
In II quarter 2014, the long-term unemployment rate stood at 5% and was by 0.2 percentage points lower than in I quarter 2014 and by 0.1 percentage points higher than in II quarter 2013.
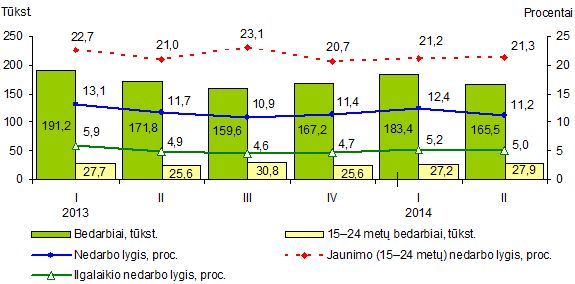 |
| Unemployment in 2013–2014, by quarters |
In II quarter 2014, there were 165.5 thousand unemployed persons aged 15–74. Over a quarter, their number decreased by 17.9 thousand (9.8%), over a year – by 6.3 thousand (3.7%).
The number of the long-term unemployed was 73.4 thousand (44.3% of the total number of unemployed), which is by 3 thousand (4%) less than in I quarter 2014 and by 0.9 thousand (1.3%) more than in II quarter 2013.
In II quarter 2014, there were 1 million 309 thousand employed persons in the country
In II quarter 2014, there were 1 million 309 thousand employed persons in the country. Compared to I quarter 2014, this number increased by 13.9 thousand (1.1%); compared to II quarter 2013, it increased by 12.1 thousand (0.9%). Over a quarter, the largest increase in the number of employed persons was observed in industrial enterprises and enterprises engaged in other service activities (5.8 thousand each), while the largest decrease – information and communication enterprises (4.7 thousand).
In II quarter 2014, nine out of ten (91.2%) employed persons were working full-time. Women were working part-time more often than men – 11 and 6.5% respectively.
In II quarter 2014, the employment rate of persons aged 15–64 stood at 65.1%; over a quarter, it increased by 0.9 percentage points, while over a year, it increased by 1.3 percentage points. The male employment rate of the said age group stood at 65.6%, female – 64.7%.
In II quarter 2014, the employment rate of persons aged 55–64 stood at 55.5%; over a quarter, it increased by 0.4 percentage points, over a year – by 2.9 percentage points.
In II quarter 2014, there were 1 million 33 thousand economically inactive persons aged 15 and older in the country, which is by 1.7 thousand (0.2%) less than in I quarter 2014.
The youth unemployment rate increased by 0.1 percentage points
In II quarter 2014, the youth (persons aged 15–24) unemployment rate stood at 21.3% and was by 0.1 percentage points higher than in I quarter 2014, and by 0.3 percentage points higher than in II quarter 2013.
In II quarter 2014, there were 27.9 thousand unemployed persons aged 15–24; against I quarter 2014, this number increased by 0.7 thousand (2.4%), against II quarter 2013, it increased by 2.2 thousand (8.7%). In II quarter 2014, every fourteenth person aged 15–24 was unemployed.
In II quarter 2014, there were 102.8 thousand employed persons aged 15–24. Over a quarter, this number increased by 1.7 thousand (1.6%), over a year – by 6.5 thousand (6.8%). 89% of employed persons aged 15–24 were working full-time.
In II quarter 2014, the youth employment rate stood at 26.5%; over a quarter, it increased by 0.6 percentage point, and over a year – by 2.4 percentage points. In II quarter 2014, every fourth person aged 15–24 was employed.
In II quarter 2014, 256.6 thousand (66.3%) persons aged 15–24 were economically inactive; out of them, 93.1% were studying at school of higher, vocational or general school.
Concepts
Unemployed – a non-working person of an established age (15–74 years) who has been actively seeking for a job (during the last four weeks) and is ready to start working in a certain period (two weeks).
Labour force – the total employed persons and the unemployed.
Long-term unemployed person – an unemployed person who has been seeking for a job for one year or longer.
Long-term unemployment rate – an indicator expressed as a ratio of the long-term unemployed to the labour force.
Inactive population – persons who are neither working nor seeking for a job and who can be categorised as neither employed nor unemployed.
Unemployment rate – an indicator expressed as a ratio of the unemployed to the labour force.
Employed persons – persons aged 15 and older doing any kind of work for which they are remunerated in cash or in kind or have income or profit.
Employment rate – an indicator expressed as a ratio of the employed persons of a selected age group to the total population of the same age.
The statistical information has been prepared based on the Labour Force Survey
data. The survey is carried out in all EU Member States, using the same
concepts and classifications, following the recommendations of the
International Labour Organization, which makes its results comparable across
the countries.
The survey has been carried using a sampling method. In II quarter 2014, 13 thousand residents (0.5%) aged 15 and older were interviewed; the results were recalculated for the total population.
More detailed statistical information on employment and unemployment is provided in the annex.
More information on the issue is available in the Database of
Indicators of
Statistics Lithuania.
Annex
Table 1.
Unemployment rate, %
|
|
2014 |
II quarter 2013 |
Growth, drop (–), percentage points, |
||
|
I quarter |
II quarter |
I quarter 2014 |
II quarter 2013 |
||
|
Total |
12.4 |
11.2 |
11.7 |
–1.2 |
–0.5 |
|
male |
13.9 |
13.2 |
13.3 |
–0.7 |
–0.1 |
|
female |
10.9 |
9.3 |
10.1 |
–1.6 |
–0.8 |
|
Youth (aged 15–24) |
21.2 |
21.3 |
21.0 |
0.1 |
0.3 |
|
Long-term unemployment rate |
5.2 |
5.0 |
4.9 |
–0.2 |
0.1 |
Table 2. The unemployed, thousand
|
|
2014 |
II quarter 2013 |
Growth, drop (–), II quarter 2014, against |
||||
|
I quarter |
II quarter |
I quarter 2014 |
II quarter 2013 |
||||
|
thousand |
per cent |
thousand |
per cent |
||||
|
Total |
183.4 |
165.5 |
171.8 |
–17.9 |
–9.8 |
–6.3 |
–3.7 |
|
male |
102.8 |
96.9 |
97.7 |
–6.0 |
–5.8 |
–0.8 |
–0.8 |
|
female |
80.5 |
68.6 |
74.1 |
–12.0 |
–14.9 |
–5.5 |
–7.5 |
|
Youth (aged 15–24) |
27.2 |
27.9 |
25.6 |
0.7 |
2.4 |
2.2 |
8.7 |
Table 3. The unemployed by duration of unemployment, thousand
|
|
2014 |
II quarter 2013 |
Growth, drop (–), II quarter 2014, |
||||
|
I quarter |
II quarter |
I quarter 2014 |
II quarter 2013 |
||||
|
thousand |
per cent |
thousand |
per cent |
||||
|
Total |
183.4 |
165.5 |
171.8 |
–17.9 |
–9.8 |
–6.3 |
–3.7 |
|
Under 1 month |
11.5 |
17.0 |
17.1 |
5.5 |
47.6 |
–0.1 |
–0.4 |
|
1–5 months |
60.6 |
37.5 |
41.6 |
–23.1 |
–38.1 |
–4.1 |
–10.0 |
|
6–11 months |
34.9 |
37.6 |
40.6 |
2.7 |
7.8 |
–3.0 |
–7.4 |
|
12 months and more (the long-term unemployed) |
76.4 |
73.4 |
72.4 |
–3.0 |
–4.0 |
0.9 |
1.3 |
Table 4. Economic activity of the population (persons aged 15 and older), thousand
|
|
2014 |
II quarter 2013 |
Growth, drop (–), II quarter 2014, against |
||||
|
I quarter |
II quarter |
I quarter 2014 |
II quarter 2013 |
||||
|
thousand |
per cent |
thousand |
per cent |
||||
|
Labour force |
1 478.7 |
1 474.7 |
1 468.9 |
–4.0 |
–0.3 |
5.7 |
0.4 |
|
Employed persons |
1 295.3 |
1 309.2 |
1 297.1 |
13.9 |
1.1 |
12.1 |
0.9 |
|
males |
634.8 |
638.2 |
634.5 |
3.4 |
0.5 |
3.7 |
0.6 |
|
females |
660.5 |
671.0 |
662.7 |
10.5 |
1.6 |
8.4 |
1.3 |
|
Unemployed |
183.4 |
165.5 |
171.8 |
–17.9 |
–9.8 |
–6.3 |
–3.7 |
|
Economically inactive persons |
1 034.7 |
1 033.0 |
1 059.0 |
–1.7 |
–0.2 |
–26.0 |
–2.5 |
Table 5. Employed persons by economic activity, thousand
|
NACE |
Economic activity |
2014 |
II quarter |
Growth, drop (–), II quarter 2014, |
||||
|
I quarter |
II quarter |
I quarter 2014 |
II quarter 2013 |
|||||
|
thousand |
% |
thousand |
% |
|||||
|
|
Total |
1 295.3 |
1 309.2 |
1 297.1 |
13.9 |
1.1 |
12.1 |
0.9 |
|
A |
Agriculture, forestry and fishing |
123.6 |
123.2 |
110.6 |
–0.5 |
–0.4 |
12.6 |
11.4 |
|
B–E |
Industry |
220.3 |
226.1 |
231.5 |
5.8 |
2.6 |
–5.4 |
–2.3 |
|
F |
Construction |
93.0 |
94.4 |
97.2 |
1.4 |
1.5 |
–2.8 |
–2.8 |
|
G–U |
Services |
858.3 |
865.5 |
857.9 |
7.2 |
0.8 |
7.6 |
0.9 |
Table 6. Employment rate, %
|
|
2014 |
II quarter 2013 |
Growth, II quarter 2014, |
||
|
I quarter |
II quarter |
I quarter 2014 |
II quarter 2013 |
||
|
Employment rate of the population aged 15–64 |
64.2 |
65.1 |
63.8 |
0.9 |
1.3 |
|
males |
64.9 |
65.6 |
64.3 |
0.7 |
1.3 |
|
females |
63.6 |
64.7 |
63.3 |
1.1 |
1.4 |
|
Employment rate of the population aged 20–64 |
70.3 |
71.3 |
69.9 |
1.0 |
1.4 |
|
Employment rate of youth (population aged 15–24) |
25.9 |
26.5 |
24.1 |
0.6 |
2.4 |
|
Employment rate of the population aged 55–64 |
55.1 |
55.5 |
52.6 |
0.4 |
2.9 |


 «The Baltic Course» Is Sold and Stays in Business!
