
Analytics, Financial Services, Latvia, Real Estate, Society
International Internet Magazine. Baltic States news & analytics
Friday, 26.04.2024, 21:28
In 2013, household consumption expenditure in Latvia has grown by 6.7%
 Print version
In accordance with the survey data during the last three years a moderate increase in the household consumption expenditure can be observed; however, consumption expenditure in 2013 was still lower than in 2008.
Household consumption expenditure at current prices in 2013 reached 91% of the level of 2008, but at constant prices – only 83%. At the same time the GDP per capita in 2013 for the first time was higher than the pre-crisis level (2008). The fact that household consumption is lagging behind the economic growth is related both to the employment level, which is still lower than that of the pre-crisis period and to the fact that households are cautious as to taking credits, which, in turn, was a very important consumption factor in 2008.
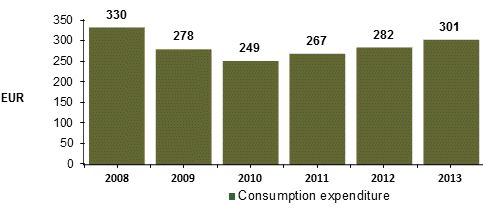 |
| Consumption expenditure trend 2008 – 2013 (on average per household member monthly, EUR) |
Consumption expenditure growth was promoted by increase of the labour remuneration (including minimum wage), increase of the share of employed persons and respective decrease of the share of unemployed in the total number of population.
Consumption expenditure was higher in urban households, where it reached on average EUR 323 per household member monthly (in Riga – EUR 365). However, the most rapid consumption expenditure increase was observed by households living in rural areas.
Consumption expenditure growth in 2013 as compared to 2012 both at current and constant prices was similar – 6.7%, since the annual average consumer price level as compared to the previous twelve months did not change.
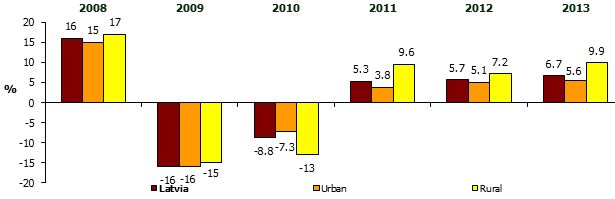 |
| Changes of household consumption expenditure (in per cent over the previous year) |
Despite the consumption expenditure growth, its structure has not changed significantly; and also in 2013 the main priorities of consumption was food, housing and transport.
Expenditure on food still takes the greatest part – on average it constitutes 28% of the total household consumption expenditure (same as in 2012). Household consumption on food as compared to the previous year has grown from EUR 79 to EUR 85 on average per household member monthly.
On average in all households expenditure on food, housing and public utilities, transport, clothing and footwear, as well as health constituted more than two thirds (70%) of the total consumption expenditure. Data show that the largest share of expenditure is still used for meeting the daily needs.
Consumption expenditure composition, structure and changes in 2013, (on average per household member monthly)
|
All households |
2013, EUR |
2013, % |
2013 over 2012, % |
|
Consumption expenditure, total |
300.72 |
100 |
106.7 |
|
Food and non-alcoholic beverages |
84.84 |
28.2 |
107.4 |
|
Alcoholic beverages, tobacco |
9.99 |
3.3 |
107.8 |
|
Clothing and footwear |
17.41 |
5.8 |
120.2 |
|
Housing, water, electricity, gas and other fuels |
49.52 |
16.5 |
104.5 |
|
Furnishings, household equipment and routine maintenance of the house |
12.72 |
4.2 |
109.9 |
|
Health |
18.50 |
6.2 |
110.5 |
|
Transport |
39.55 |
13.2 |
99.5 |
|
Communications |
12.70 |
4.2 |
96.4 |
|
Recreation and culture |
21.21 |
7.1 |
112.8 |
|
Education |
4.31 |
1.4 |
93.4 |
|
Hotels, cafes and restaurants |
13.14 |
4.4 |
103.3 |
|
Miscellaneous goods and services |
16.82 |
5.6 |
116.4 |
The most rapid growth was recorded in the expenditure on clothing and footwear – of 20%, on miscellaneous goods and services – of 16% (in particular individual care goods and services), as well as on recreation and culture – of 13%.
Expenditure on health increased by 10.5%; besides in 2013 households spent comparatively more on pharmaceutical products than in 2012. In other consumption groups the growth was smaller. The decrease in the expenditure on transport and communication is related to the drop of tariffs of these services. In turn, the decrease in the expenditure on education is affected by the declining number of students in higher education establishments.
Despite the fact that in 2013 consumption expenditure at current prices was lower than in 2008, household expenditure on housing and public utilities (by EUR 11), health (by EUR 2), and food and non-alcoholic beverages (EUR 1) exceeded the level of 2008. It was affected by a rapid price growth for housing and public utility costs of 21%, health – of 17% and food and non-alcoholic beverages – of 12 % in 2009 – 2013.
In 2013, 3931 household from different places of Latvia was engaged in the Household Budget Survey. More information on the results of the Household Budget Survey 2013 will be available in the CSB databases from 28 August 2014.


 «The Baltic Course» Is Sold and Stays in Business!
