
Analytics, Industry, Lithuania, Markets and Companies
International Internet Magazine. Baltic States news & analytics
Friday, 26.04.2024, 16:19
In June, prices for the total industrial production sold decreased by 2.4% in Lithuania
 Print version
The overall price change was mainly influenced by a 2.8% increase in prices for the production of the manufacture of refined petroleum products and by a 1.7% decrease in prices for the production of electricity, gas, steam and air conditioning supply (2.9% – gas, 3.2% – steam and air conditioning supply), 2.2% – chemicals and chemical products (see Table 2).
Over the month, prices for industrial production sold on the Lithuanian market decreased by 0.9%. The largest decrease in prices was observed for the production of printing and reproduction of recorded media (2.8%), manufacture of beverages (2.3%), increase – for the production of waste collection, treatment and disposal activities, materials recovery (3.5%), extraction of crude petroleum (2.8%). Prices for food products decreased by 0.6%, of which for ice cream – by 17.1, bread and fresh pastry goods – 3.4, processed and preserved fruit and vegetables and rusks and biscuits, preserved pastry goods and cakes – 2.7% each. Meanwhile, price for sugar increased by 5.3, condiments and seasonings – 4.2, cocoa, chocolate and sugar confectionery – 3.1%.
Over the month, prices for products sold on the non-Lithuanian market increased by 1%. An increase was observed in prices for the production of extraction of crude petroleum (5%), manufacture of refined petroleum products (3.9%), ), a decrease – for the production of the manufacture of printing and reproduction of recorded media (4.3%) and manufacture of computer, electronic and optical products (3.3%).
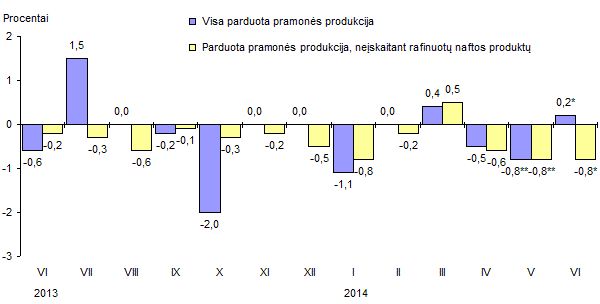 |
| Producer prices for industrial production, changes per month, compared to the previous month |
Over the year (June 2014, against June 2013), prices for the total industrial production sold decreased by 2.4, refined petroleum products excluded – by 4.4%. It was mainly influenced by a 13.9% decrease in prices for the production of the manufacture of chemicals and chemical products and a 2.5% increase in prices for the production of the manufacture of refined petroleum products.
The largest price drop was observed for the production of electricity, gas, steam and air conditioning supply (10.5%), manufacture of computer, electronic and optical products (7.4%), while prices for the production of water collection, treatment and supply increased by 18.3, manufacture of tobacco products – 12.9%.
Table 1. Changes in prices for industrial production sold, June 2014, %
|
Economic activities |
Relative |
Price growth, drop (-) |
||
|
June 2014 |
2013 |
|||
|
December |
June |
|||
|
Total industrial production sold |
100.0 |
0.2 |
−1.7 |
−2.4 |
|
Mining and quarrying |
0.9 |
1.3 |
−0.9 |
1.9 |
|
Manufacturing |
86.1 |
0.4 |
−0.8 |
−1.3 |
|
Manufacture of refined petroleum products |
28.6 |
2.8 |
0.7 |
2.5 |
|
Electricity, gas, steam and air
conditioning |
12.1 |
−1.7 |
−8.1 |
−10.5 |
|
Water supply; sewerage, waste
management and |
0.9 |
2.0 |
4.4 |
0.7 |
|
Total industrial
production, refined petroleum |
71.4 |
−0.8 |
−2.6 |
−4.4 |
|
Manufacturing
production, refined petroleum |
57.5 |
−0.7 |
−1.6 |
−3.3 |
|
Total industrial production sold on the Lithuanian market |
100.0 |
−0.9 |
−3.9 |
−4.7 |
|
Mining and quarrying |
1.3 |
1.5 |
−1.8 |
1.1 |
|
Manufacturing |
68.5 |
−0.7 |
−2.4 |
−2.5 |
|
Manufacture of refined petroleum products |
14.1 |
−1.4 |
−6.7 |
−1.7 |
|
Electricity, gas, steam and air conditioning supply |
29.0 |
−1.7 |
−8.1 |
−10.5 |
|
Water supply; sewerage, waste
management and |
1.2 |
2.1 |
12.3 |
16.5 |
|
Total industrial production sold on the Lithuanian market, refined petroleum products excluded |
85.9 |
−0.8 |
−3.4 |
−5.1 |
|
Manufacturing
production, refined petroleum |
54.4 |
−0.5 |
−1.3 |
−2.7 |
|
Total industrial production sold on the non-Lithuanian market |
100.0 |
1.0 |
−0.1 |
−0.8 |
|
Mining and quarrying |
0.5 |
1.1 |
0.7 |
3.3 |
|
Manufacturing |
98.7 |
1.0 |
−0.1 |
−0.7 |
|
Manufacture of refined petroleum products |
38.9 |
3.9 |
2.7 |
3.8 |
|
Electricity, gas, steam and air conditioning supply |
- |
- |
- |
- |
|
Water supply; sewerage, waste
management and |
0.8 |
1.8 |
−4.0 |
−15.0 |
|
Total industrial production sold on the non-Lithuanian market, refined petroleum products excluded |
61.1 |
−0.9 |
−1.8 |
−3.8 |
|
Manufacturing
production, refined petroleum |
59.8 |
−0.9 |
−1.8 |
−3.7 |
- such a phenomenon (indicator) was not observed during the respective period.
Table 2. The greatest influence on the monthly (June 2014, against May) change in prices for industrial production sold by economic activity, percentage points
|
EVRK |
Economic activities |
Influence |
EVRK |
Economic activities |
Influence |
|
Total industrial production sold |
|||||
|
19 |
Manufacture of refined petroleum |
+0.808 |
35 |
Electricity, gas, steam and air conditioning supply |
−0.201 |
|
33 |
Repair and installation of machinery and equipment |
+0.021 |
20 |
Manufacture of chemicals and |
−0.198 |
|
38 |
Waste collection, treatment and disposal activities; materials recovery |
+0.015 |
10 |
Manufacture of food products |
−0.121 |
|
22 |
Manufacture of rubber and plastic products |
+0.013 |
11 |
Manufacture of beverages |
−0.040 |
|
06 |
Extraction of crude petroleum |
+0.012 |
18 |
Printing and reproduction of |
−0.030 |
|
Industrial production sold on the Lithuanian market |
|||||
|
33 |
Repair and installation of machinery and equipment |
+0.036 |
35 |
Electricity, gas, steam and air conditioning supply |
−0.486 |
|
31 |
Manufacture of furniture |
+0.026 |
19 |
Manufacture of refined petroleum |
−0.199 |
|
38 |
Waste collection, treatment and disposal activities; materials recovery |
+0.018 |
10 |
Manufacture of food products |
−0.123 |
|
14 |
Manufacture of wearing apparel |
+0.014 |
11 |
Manufacture of beverages |
−0.098 |
|
22 |
Manufacture of rubber and plastic products |
+0.014 |
16 |
Manufacture of wood and wood |
−0.039 |
|
Industrial production sold on the non-Lithuanian market |
|||||
|
19 |
Manufacture of refined petroleum |
+1.517 |
20 |
Manufacture of chemicals and |
−0.337 |
|
16 |
Manufacture of wood and wood |
+0.021 |
10 |
Manufacture of food products |
−0.120 |
|
38 |
Waste collection, treatment and disposal activities; materials recovery |
+0.014 |
26 |
Manufacture of computer, electronic and optical products |
−0.046 |
|
22 |
Manufacture of rubber and plastic products |
+0.012 |
14 |
Manufacture of wearing apparel |
−0.037 |
|
06 |
Extraction of crude petroleum |
+0.011 |
18 |
Printing and reproduction of |
−0.024 |
1National version of NACE Rev. 2.
The overall change in prices for industrial production sold is influenced not only by the rate of change in the price of a certain product but also by the relative share (weight) of the industrial production sold within certain economic activity in the total industrial production.
For more information, see the Database of Indicators.


 «The Baltic Course» Is Sold and Stays in Business!
