
Analytics, Industry, Latvia, Markets and Companies
International Internet Magazine. Baltic States news & analytics
Friday, 26.04.2024, 13:19
In March, producer prices in Latvian industry dropped by 0.2%
 Print version
The prices of products sold on the domestic market dropped by 0.2%, and prices of exported products – by 0.1%; of which in exports to euro area countries increased by 0.2%, while in exports to non-euro area countries declined by 0.3%. Over the month producer prices were mostly affected by price drop in manufacture of computer, electronic and optical products and in manufacture of food products, as well as by price growth in manufacture of wood and wood products, except furniture.
In March 2014, compared to March 2013, the overall level of producer prices in the Latvian industry grew by 0.6%.The producer prices of products sold on the domestic market rose by 0.5%, and prices of exported products – by 0.8%. The price rise in manufacture of wood and wood products, except furniture (by 0.93 percentage points) and in electricity, gas, steam and air conditioning supply (by 0.3 percentage points) had the greatest increasing impact. In its turn, the largest decreasing impact had drop of prices in manufacture of computer, electronic and optical products (by 0.46 percentage points) and in manufacture of chemicals and chemical products (by 0.15 percentage points).
Producer price changes in March 2014
|
|
Weights (%) |
Price changes (%) in March 2014 compared to |
||
|
February 2014 |
March 2013 |
|||
|
Total industrial production |
100.0 |
-0.2 |
0.6 |
|
|
|
Mining and quarrying |
2.1 |
-0.4 |
1.9 |
|
|
Manufacturing |
73.5 |
-0.1 |
0.6 |
|
|
Electricity, gas, steam and air conditioning supply |
20.4 |
-0.2 |
1.5 |
|
|
Water supply, sewerage, waste management and remediation activities |
4.0 |
-0.7 |
-2.6 |
|
Products sold on the domestic market |
100.0 |
-0.2 |
0.5 |
|
|
|
Mining and quarrying |
1.6 |
0.4 |
2.1 |
|
|
Manufacturing |
54.8 |
-0.1 |
0.8 |
|
|
Electricity, gas, steam and air conditioning supply |
36.9 |
-0.4 |
0.3 |
|
|
Water supply, sewerage, waste management and remediation activities |
6.7 |
-0.4 |
-1.4 |
|
Exported products |
100.0 |
-0.1 |
0.8 |
|
|
|
of which: |
|
|
|
|
|
mining and quarrying |
2.6 |
-1.0 |
1.8 |
|
|
manufacturing |
94.0 |
-0.2 |
0.4 |
|
|
water supply, sewerage, waste management and remediation activities |
1.2 |
-2.6 |
-7.7 |
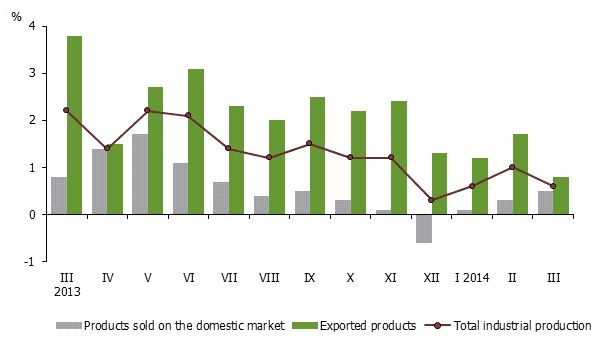 |
| Producer price changes in % over the corresponding month of the previous year |
Data source: Central Statistical Bureau of Latvia
This year data on producer prices are provided by more than 660 enterprises which, for the calculation of index, each month provide CSB with around 3.1 thousand prices, of which 1.6 thousand prices for products sold on the domestic market and 1.5 thousand – for exported products and industrial services.
More detailed information on producer price changes is available in the CSB database in section Producer prices.


 «The Baltic Course» Is Sold and Stays in Business!
