
Analytics, Industry, Lithuania, Markets and Companies
International Internet Magazine. Baltic States news & analytics
Friday, 26.04.2024, 20:41
In March, industrial production in Lithuania decreased by 0.7%
 Print version
Over the month, mining and quarrying and manufacturing production increased by 2%, seasonally adjusted – decreased by 3.2%; manufacturing production increased by 1.7%, seasonally adjusted – decreased by 3.3%.
In March 2014, compared to February, the largest decrease in industrial production was observed in the manufacture refined petroleum products (16.5%), electricity, gas, steam and air conditioning supply (16.3%), and the manufacture of wearing apparel (15.3%).
Over the month, the increase in industrial production was observed in the manufacture of basic pharmaceutical products and pharmaceutical preparations (74.8%), other non-metallic mineral products (31.1%), beverages (23.5%), repair and installation of machinery and equipment (17.8%), manufacture of rubber and plastic products (16.2%), fabricated metal products, except machinery and equipment (13.5%).
Table 1. changes in industrial production, at constant prices of 2010, growth, drop, (−), %
|
Economic activities |
March 2014, against |
||||
|
February |
February, seasonally adjusted |
March 2013 |
March 2013, working day adjusted |
2010 monthly average |
|
|
Industry (B–E) |
−0.7 |
−3.6 |
−12.9 |
−10.2 |
5.9 |
|
Mining and quarrying, manufacturing (B and C) |
2.0 |
−3.2 |
−10.1 |
−6.7 |
10.8 |
|
Mining and quarrying (B) |
26.6 |
2.7 |
29.6 |
25.0 |
15.2 |
|
Manufacturing (C) |
1.7 |
−3.3 |
−10.4 |
−6.9 |
10.7 |
|
Manufacturing (except for the manufacture of refined petroleum products) (C-C19) |
6.9 |
0.9 |
5.7 |
9.1 |
35.4 |
|
Electricity, gas, steam and air conditioning supply (D) |
−16.4 |
−7.7 |
−29.6 |
−30.3 |
−19.8 |
|
Water supply, sewerage, waste management and remediation activities (only Division 36 of Section E – water collection, treatment and supply) |
2.7 |
−0.3 |
4.0 |
1.7 |
0.2 |
|
Main industrial groupings |
|
|
|
|
|
|
Energy products |
−16.1 |
−10.9 |
−40.2 |
−37.1 |
−32.2 |
|
Intermediate goods |
6.5 |
0.6 |
3.0 |
5.6 |
30.4 |
|
Capital goods |
18.9 |
8.3 |
16.1 |
22.1 |
58.4 |
|
Consumer durables |
3.7 |
1.8 |
16.7 |
18.6 |
81.5 |
|
Consumer non-durables |
5.0 |
−0.5 |
2.2 |
4.1 |
22.5 |
In March 2014, compared to March 2013, industrial production decreased by 12.9% at constant prices, working day adjusted – 10.2%. Over the year, mining and quarrying and manufacturing production decreased by 10.1%, working day adjusted – by 6.7%; manufacturing production decreased by 10.4%, working day adjusted – 6.9%.
In January–March 2014, industrial production totalled LTL 16179.5 million at current prices and, compared to the same period in 2013, decreased by 7.6% at constant prices, working day adjusted –6.8%. Over the said period, mining and quarrying and manufacturing industrial production decreased by 6.3%, working day adjusted – 5.2%; manufacturing production decreased by 6.5%, working day adjusted – 5.4%.
Table 2. Changes in industrial production, at constant prices of 2010, growth, drop, (−), %
|
Economic activities |
January–March 2014, against |
|
|
January–March 2013 |
January–March 2013, working day adjusted |
|
|
Industry (B–E) |
−7.6 |
−6.8 |
|
Mining and quarrying, manufacturing (B and C) |
−6.3 |
−5.2 |
|
Mining and quarrying (B) |
16.8 |
15.7 |
|
Manufacturing (C) |
−6.5 |
−5.4 |
|
Manufacturing (except for the manufacture of refined petroleum products) (C−C19) |
9.1 |
9.7 |
|
Electricity, gas, steam and air conditioning supply (D) |
−15.2 |
−15.1 |
|
Water supply, sewerage, waste
management and |
3.1 |
2.7 |
|
Main industrial groupings |
|
|
|
Energy products |
−30.7 |
−28.7 |
|
Intermediate goods |
5.9 |
6.5 |
|
Capital goods |
18.5 |
18.4 |
|
Consumer durables |
14.5 |
14.8 |
|
Consumer non-durables |
8.7 |
8.8 |
In January–March 2014, compared to January–March 2013, the proportion of mining and quarrying and manufacturing sales and services on the non-Lithuanian market dropped by 5.6 percentage points and made up 65.1%, on the Lithuanian market – grew by 5.6 percentage points and made up 34.9%.
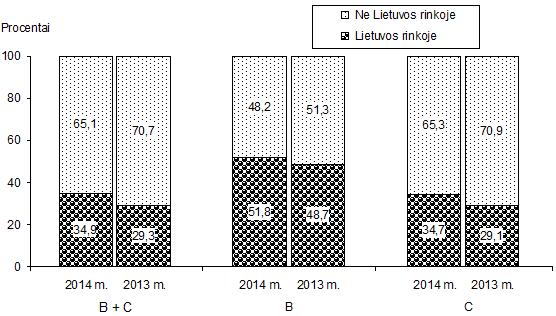 |
| Mining and quarrying, manufacturing; corporate sales and service structure of the market in January-March 2014 |
Mining and quarrying – B
Manufacturing – C
In January–March 2014, compared to January–March 2013, the value of sales and services of industrial enterprises on the non-Lithuanian market dropped by 18.4% at current prices. It was mainly influenced by a 51.6% decrease in sales of refined petroleum products. The value of sales and services on the non-Lithuanian market, refined petroleum products excluded, grew by 4.2% at current prices. It was influenced by an increase in the industrial production of the sales of enterprises engaged in the manufacture of rubber and plastic products (38%), food products (9.8%), furniture (13.7%).
Over the period in question, the value of mining and quarrying and manufacturing sales and services on the Lithuanian market grew by 5.9% at current prices, refined petroleum products excluded – 9.7%.
Concepts
Industrial production refers to the value (VAT and excise excluded) of the sales of goods produced and manufacturing work carried out by an enterprise. For the calculation of changes in industrial production, a producer price index is used.
Sales and services of industrial enterprises refers to the income of en economic entity received during a certain period through the sale of goods manufactured by the economic entity or through the provision of industrial services. The sales of goods purchased for resale, byproducts, other ancillary services to third persons are included. Income from the sale of tangible fixed assets, financial and investment activity, windfall and the like are not included.
More information on the issue is available in the Database of Indicators.


 «The Baltic Course» Is Sold and Stays in Business!
