
Analytics, Industry, Latvia, Markets and Companies, Metals Market
International Internet Magazine. Baltic States news & analytics
Wednesday, 08.05.2024, 23:07
In February industrial production volume in Latvia grew just by 0.9%
 Print version
Compared to February 2013, industrial production in February (according to calendar adjusted data at constant prices) has dropped by 1.7%. Of which reduction in manufacturing – by 0.6%, in electricity and gas supply – by 5.9%, whereas industrial production in mining and quarrying has grown by 10.2%.
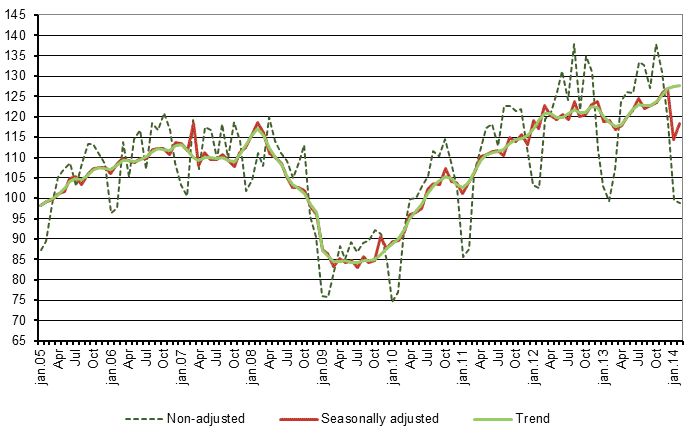 |
| Volume index of manufacturing (2010=100) |
Data source: Central Statistical Bureau of Latvia
Significant turnover reduction in February was also recorded in manufacture of basic metals (of 78.3%), in manufacture of wearing apparel (of 18.6%) and in repair and installation of machinery and equipment (repair and maintenance of ships and boats, repair of fabricated metal products, machinery and equipment, installation of industrial machinery and equipment) (of 11.1%).
But production increase, as compared to February of last year, was in manufacture of computer, electronic and optical products (of 23.3%), in manufacture of beverages (of 11.8%) and in major manufacturing sectors by share: in manufacture of food products – increase of 10.5% and in manufacture of wood and of products of wood – by 5.8%.
In March of this year CSB has carried out revision of weights structure of value added used in calculation of industrial production index basing on the latest information available on structural changes in Manufacture of basic metals (NACE 24).
As revised weights structure is applied starting with 2014, industrial production volume indices in January 2014 are also adjusted.
Changes in volume indices of production, % (at constant prices)
|
|
January – February 2014 compared to January – February 2013 (calendar adjusted) |
January 2014 compared to |
February 2014 compared to |
||
|
December 2013 (seasonally adjusted) |
January 2014 (calendar adjusted) |
January 2014 (seasonally adjusted) |
February 2013 (calendar adjusted) |
||
|
All production |
-3.7 |
-3.1 |
-5.5 |
0.9 |
-1.7 |
|
Mining and quarrying |
8.0 |
-3.7 |
5.7 |
7.9 |
10.2 |
|
Manufacturing production |
-2.1 |
-9.9 |
-3.5 |
3.3 |
-0.6 |
|
Manufacture of food products |
8.1 |
-0.5 |
5.9 |
2.2 |
10.5 |
|
Manufacture of textiles |
4.7 |
7.1 |
6.9 |
-9.1 |
2.4 |
|
Manufacture of wearing apparel |
-16.1 |
-5.6 |
-13.4 |
-1.6 |
-18.6 |
|
Manufacturing of wood and cork articles, except furniture |
4.7 |
-8.2 |
3.7 |
3.3 |
5.8 |
|
Manufacture of chemicals and chemical products |
1.2 |
0.0 |
-0.5 |
0.2 |
3.6 |
|
Manufacture of other non-metallic mineral products |
4.5 |
-0.9 |
-0.8 |
8.8 |
10.0 |
|
Manufacturing of basic metals |
-81.6 |
-60.6 |
-83.7 |
45.4 |
-78.3 |
|
Manufacturing of fabricated metal products, except machinery and equipment |
-0.5 |
12.8 |
2.5 |
-6.0 |
-3.4 |
|
Manufacture of computer, electronic and optical products |
25.5 |
-15.7 |
28.0 |
1.4 |
23.3 |
|
Manufacture of electrical equipment |
0.9 |
-0.3 |
-6.1 |
8.4 |
8.4 |
|
Manufacturing of machinery and equipment |
3.1 |
-7.2 |
-3.4 |
1.2 |
8.6 |
|
Manufacture of motor vehicles, trailers and semi-trailers |
14.7 |
-0.7 |
28.1 |
-1.6 |
6.7 |
|
Manufacture of furniture |
5.6 |
8.3 |
8.5 |
0.4 |
3.0 |
|
Repair and installation of machinery and equipment (repair and maintenance of ships and boats, repair of fabricated metal products, machinery and equipment, installation of industrial machinery and equipment) |
-10.2 |
4.5 |
-9.6 |
-7.6 |
-11.1 |
|
Electricity and gas supply |
-9.0 |
5.8 |
-11.4 |
-1.8 |
-5.9 |
More information on seasonally adjusted, calendar adjusted and non-adjusted industrial production volume indices and weights structure used in the calculations is available in the CSB databases.


 «The Baltic Course» Is Sold and Stays in Business!
