
Analytics, Industry, Lithuania, Markets and Companies
International Internet Magazine. Baltic States news & analytics
Friday, 26.04.2024, 14:05
In Lithuania, industrial output dropped by 3.1% in December y-o-y
 Print version
Over the month, mining and quarrying and manufacturing output decreased by 4.9%, seasonally adjusted – by 1.5%; manufacturing output decreased by 4.8%, seasonally adjusted – by 1.5%.
In December, compared to November, the largest decrease in output was observed in the manufacture of basic pharmaceutical products and pharmaceutical preparations (54.3%), motor vehicles, trailers and semi-trailers (45.3%), base metals (31%), wood and wood products, except furniture (24.9%), other non-metallic mineral products (24.6%), and other manufacturing (23.4%).
Over the month, output increased the most in the manufacture of other transport equipment (20.1%), beverages (17.7%), refined petroleum products (13.2%), chemicals and chemical products (1.5%), and food products (0.7%).
Table 1. Changes in industrial output, at constant prices of 2010, growth, drop, (−), %
|
Economic activities |
December 2013, against |
||||
|
November |
November, seasonally adjusted |
December 2012 |
December 2012, working day adjusted |
2010 monthly average |
|
|
Industry (B–E) |
−1.6 |
−0.8 |
−3.1 |
−3.8 |
13.2 |
|
Mining and quarrying, manufacturing (B and C) |
−4.9 |
−1.5 |
0.1 |
−1.5 |
15.5 |
|
Mining and quarrying, manufacturing (B) |
−26.0 |
2.5 |
9.1 |
7.8 |
−17.4 |
|
Manufacturing (C) |
−4.8 |
−1.5 |
0.0 |
−1.6 |
15.8 |
|
Manufacturing (except for the manufacture of refined petroleum products) (C except C19) |
−10.4 |
−0.7 |
11.7 |
10.3 |
23.5 |
|
Electricity, gas, steam and air conditioning supply (D) |
26.4 |
5.2 |
−18.7 |
−15.5 |
1.4 |
|
Water supply, sewerage, waste management and remediation activities (only Division 36 of Section E – water collection, treatment and supply) |
0.6 |
0.7 |
2.1 |
2.4 |
1.7 |
|
Main industrial groupings |
|
|
|
|
|
|
Energy products |
17.4 |
−1.2 |
−19.9 |
−21.6 |
0.4 |
|
Intermediate goods |
−13.9 |
−1.8 |
13.1 |
11.6 |
11.3 |
|
Capital goods |
−12.8 |
−5.0 |
1.1 |
1.4 |
40.8 |
|
Consumer durables |
−17.4 |
−1.1 |
19.5 |
16.2 |
44.6 |
|
Consumer non-durables |
−3.4 |
1.5 |
11.5 |
11.6 |
26.8 |
In December 2013, compared to December 2012, industrial output dropped by 3.1% at constant prices, working day adjusted – by 3.8%. Over the year, mining and quarrying and manufacturing output grew by 0.1%, working day adjusted – dropped by 1.5%; manufacturing output remained unchanged, working day adjusted – decreased by 1.6%.
In January–December 2013, industrial output totalled LTL 71 650.6 million at current prices and, compared to the same period in 2012, grew by 3.3% at constant prices; it was not influenced by the number of working days. Over the said period, mining and quarrying and manufacturing output grew by 4.7%, working day adjusted – by 4.6%; manufacturing output increased by 4.7%, working day adjusted – by 4.5%.
Table 2. Changes in industrial output, at constant prices of 2010, growth, drop, (−), %
|
Economic activities |
January–December 2013, against |
|
|
January–December 2012 |
January–December 2012, working day adjusted |
|
|
Industry (B–E) |
3.3 |
3.3 |
|
Mining and quarrying, manufacturing (B and C) |
4.7 |
4.6 |
|
Mining and quarrying, manufacturing (B) |
10.8 |
10.8 |
|
Manufacturing (C) |
4.7 |
4.5 |
|
Manufacturing (except for the manufacture of refined petroleum products) (C except C19) |
5.4 |
5.9 |
|
Electricity, gas, steam and air conditioning supply (D) |
−7.2 |
−6.7 |
|
Water supply, sewerage, waste management and remediation activities (only Division 36 of Section E – water collection, treatment and supply) |
0.5 |
0.6 |
|
Main industrial groupings |
|
|
|
Energy products |
−0.4 |
−1.8 |
|
Intermediate goods |
4.6 |
5.0 |
|
Capital goods |
10.7 |
11.4 |
|
Consumer durables |
6.8 |
7.2 |
|
Consumer non-durables |
4.6 |
5.5 |
In January–December 2013, compared to January–December 2012, the proportion of mining and quarrying and manufacturing sales and services on the non-Lithuanian market dropped by 0.2 percentage points and made up 66.4%, on the Lithuanian market – grew by 0.2 percentage points and made up 33.6%.
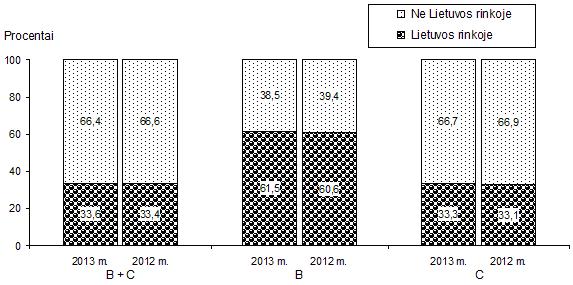 |
| Mining and quarrying by manufacturing and sales companies and services market structure in January-December |
Mining and quarrying – B
Manufacturing – C
The largest proportion of sales and services on the non-Lithuanian market was made up of the output of the manufacture of refined petroleum products (36.3%), food products (12.5%), chemicals and chemical products (12.3%), furniture (6.2%), rubber and plastic products (4.2%), and wood and wood products, except for furniture (4.0%).
In January–December 2013, compared to January–December 2012, the value of sales and services of industrial enterprises on the non-Lithuanian market grew by 2.3% at current prices. It was influenced by an increase in the sales of the output of the manufacture of wood and wood products, except for furniture (20%), rubber and plastic products (18.7%), food products (5.2%), and furniture (8.3%). Over the period in question, the value of mining and quarrying and manufacturing sales and services on the Lithuanian market grew by 3.5% at current prices.
Concepts
Industrial output refers to the value (VAT and excise excluded) of the sales of goods produced and manufacturing work carried out by an enterprise. For the calculation of changes in industrial output, a producer price index is used.
Sales and services of industrial enterprises refers to the income of an economic entity received during a certain period through the sale of goods manufactured by the economic entity or through the provision of industrial services. The sales of goods purchased for resale, by products, other ancillary services to third persons are included. Income from the sale of tangible fixed assets, financial and investment activity, windfall and the like are not included.


 «The Baltic Course» Is Sold and Stays in Business!
